
Two weeks ago I published How the Boston Red Sox could be an unlucky .500 team. It showed that if you randomly scramble up the Red Sox runs scored numbers from all their 2026 games, they would almost always end up with a few more wins than the 31 they actually had. Most typically, they’d be just under .500 for a winning percentage.
That article goes into detail about the thinking behind this analysis, and how it works.
It’s 2 weeks later now, and the Red Sox have done a bit more winning than losing in that time. I thought I’d check to see what their updated chart looks like. And here it is, through Friday’s opener against the Angels on July 3:
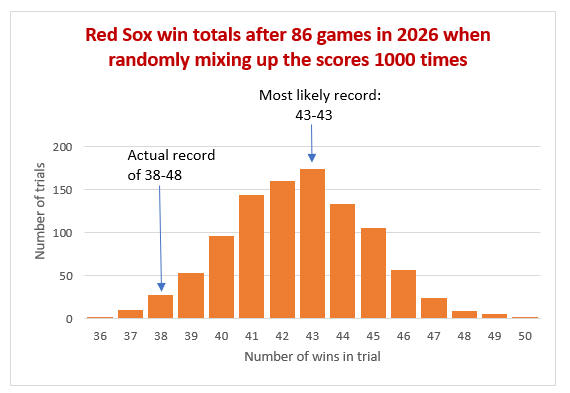
When randomly rearranging their scores, over 96% of the trials gave the Red Sox a better record than their current 38-48. The most likely outcome was an even .500 record of 43-43. 33.4% of trials were above .500, while 49.2% were below .500.
The Pythagorean Win-Loss formula also predicts a 43-43 record for the Red Sox.
So either the Red Sox have been unlucky this year, and are better than their record, or they’re just poor at winning close games.
