
The Boston Red Sox offense has been up and down this year, but on the whole seems not bad. Their pitching has been very good this year. So has their defense.
So why do they have such a bad record of 31-43 (through the games of Saturday, June 21)?
I’ve noticed there are a lot of games where they come close, but fall just a little short. Sometimes the pitching is there, but the offense isn’t quite enough. Then the offense picks up, but at the same time the pitching falters. Could this be just a case of bad timing? Had they achieved the same game run totals, but just in different games, would the results be about the same, or better, or worse?
To be sure I’m conveying what I mean correctly, here’s an example. Suppose a team has played 3 games so far in a new baseball season. Their results are as follows:
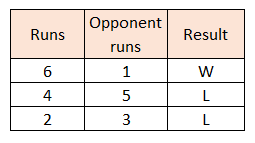
Their record is 1-2. But it seems they’re playing better than their record – their losses are close, their win is not. They have more runs scored than allowed, overall.
What if the 6-run game had happened when their opponent scored 5 runs? They’d have won that game then. Swapping those first two scores earns them an extra win:
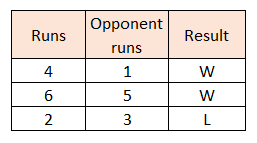
Well that’s interesting. The same performances in a different order gives a different win total. What if we continue this practice? Here are all six orderings that can be done:
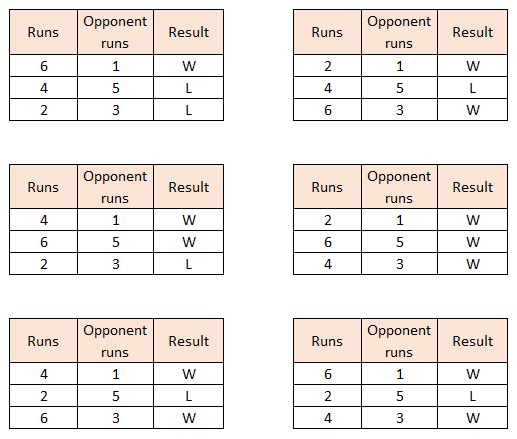
In every alternative ordering, this team gets more wins. In one ordering, they even win all their games! But in most, then have a 2-1 record. Here’s a histogram showing how often each record occurs among the different reorderings:
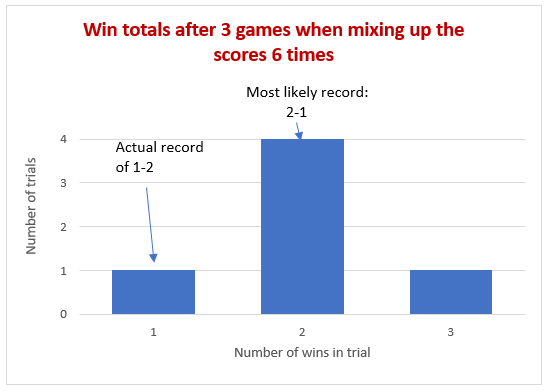
83% of outcomes are better than their actual record.
Of this team, I would say one of two things. Either they have been unlucky so far, or they have done a poor job at winning close games.
We can do basically this same analysis on the 2026 Boston Red Sox, but because they have 74 games played instead of 3, we can’t calculate the win-loss totals for every possible reordering of their games. The number of different reorderings of 74 games is a huge number, it’s a number with 108 digits. If all the computers on Earth worked together generating those reorderings and evaluating the number of wins for each, and continued working on it for the entire age of the universe, they would barely scratch the surface of the problem.
Fortunately, we can get a good idea of the shape of things by random sampling. While holding the opponents’ scores in their original order, I randomly reordered the Red Sox scores, and counted win totals. And to ensure apples-to-apples comparisons, I did not use end-of-game scores for extra innings games; I always used the score at the end of nine innings. This could still create some imbalance in games where the home team wins after 8 ½ innings or so, but I did not try to compensate for that.
When I got a tie result, I split those results 50/50 – half wins, half losses. This led to some trials producing fractional win totals, such as 33.5. To keep the results to whole numbers of wins and losses, every fractional win total got its count split evenly between the whole number above it, and the whole number below it. For example, there were 42 trials that had a win total of 33.5. So 21 of those trials got counted as 33-win trials, and 21 of them got counted as 34-win trials.
After doing all that, here is a histogram of the results:
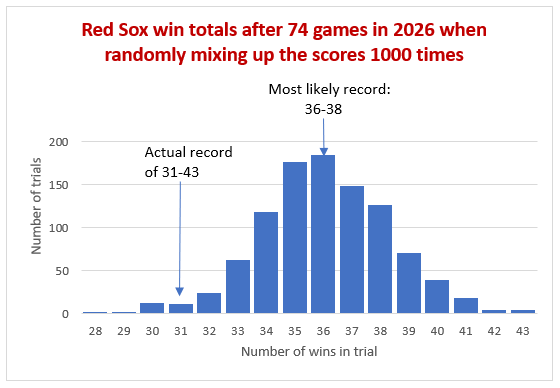
Their actual record is down at the lower end of this. Only 2.6% of trials resulted in 31 or fewer wins. That means 97.4% of outcomes were better than their actual record.
18.5% of trials resulted in the most likely win total of 36. This is just one win shy of a .500 record.
Interesting note: there is a formula called “Pythagorean Win-Loss” that predicts what a team’s record ought to be based on its total runs scored and runs allowed. While using less information than the process I described above, it produces the same prediction of a 36-38 record. You can look it up on Baseball-Reference.
But I can draw a few more conclusions. Such as that 59% of outcomes had the Red Sox with a losing record; 15% had them with a .500 record; and 26% had them with a winning record. So there is a greater than 1 in 4 chance that the Red Sox would have a winning record right now, and more than a 2 in 5 chance they would not be a losing team, if their run totals had just happened in a different order this year.
I draw the same conclusion for these 2026 Red Sox as I did for the example above: either they have been unlucky so far, or they have done a poor job at winning close games. My guess is a little of both. That they’re an unlucky team that nonetheless has some fundamental things to work on if they want to be a playoff-caliber team.

This is exactly the analysis I’ve been looking for to confirm my totally spurious hunch that the 2026 Red Sox either have been unlucky / don’t have the moxy to win close games (their inability to come back when not scoring first seems to be some indication of ‘mettle’) / or, are suffering through early-stage Curse of Mookie Betts (and therefore will not win another championship in our lifetimes).