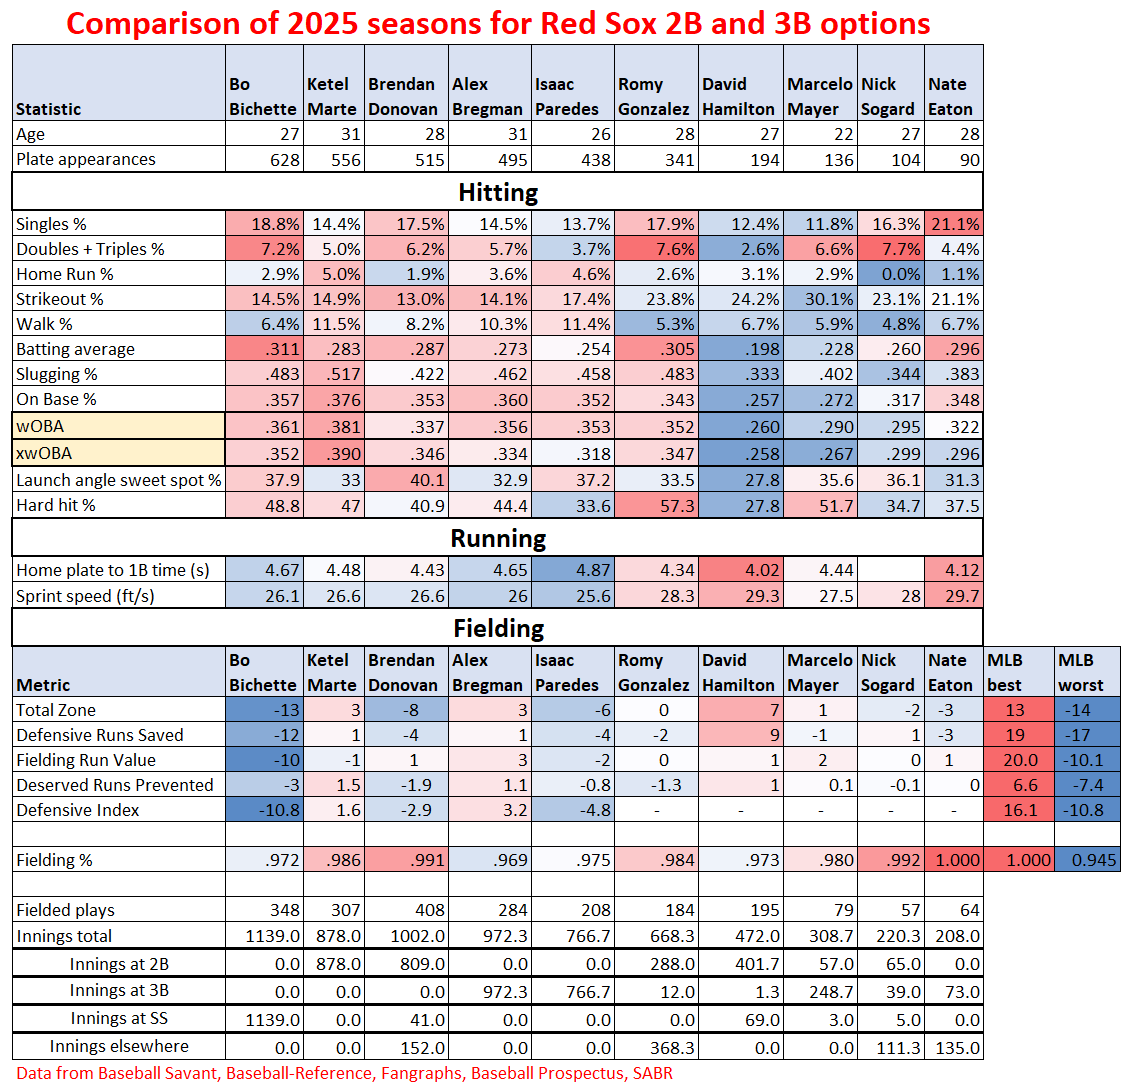
Three weeks ago I posted charts comparing the 2025 seasons of players that, at least in the press, were being considered as options for the Red Sox to play at second base and/or third base in 2025. Most of these players not currently being part of the organization. Much has changed these past 3 weeks, and so an update was called for. Below find the updated chart with new players added, some utility players removed, and a couple of extra stats added to make the picture a bit more complete. I’ve kept Alex Bregman, Bo Bichette, and Ketel Marte on the list even though they are no longer options, just to serve as reference points. I’ve also highlighted names of players currently on the Red Sox in red.
As before, the order was chosen based on number of plate appearances in 2025. Most on the left, least on the right.
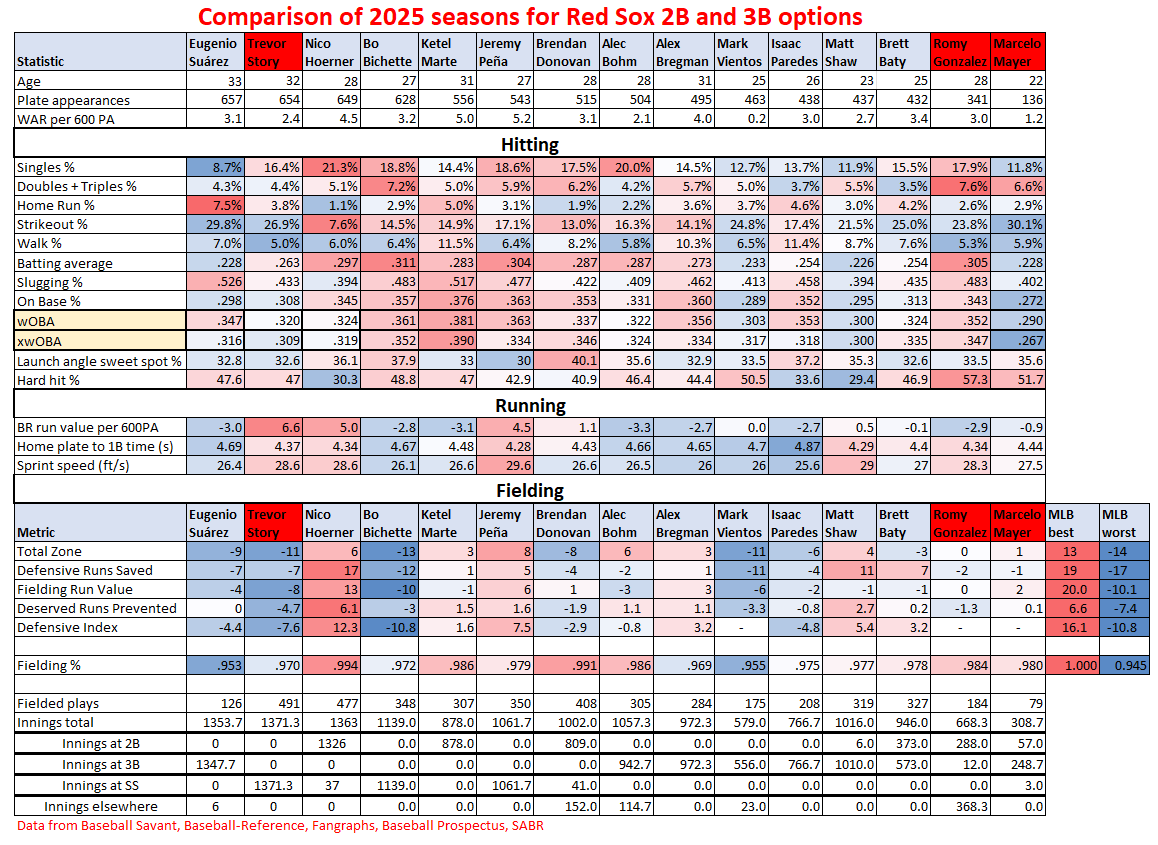
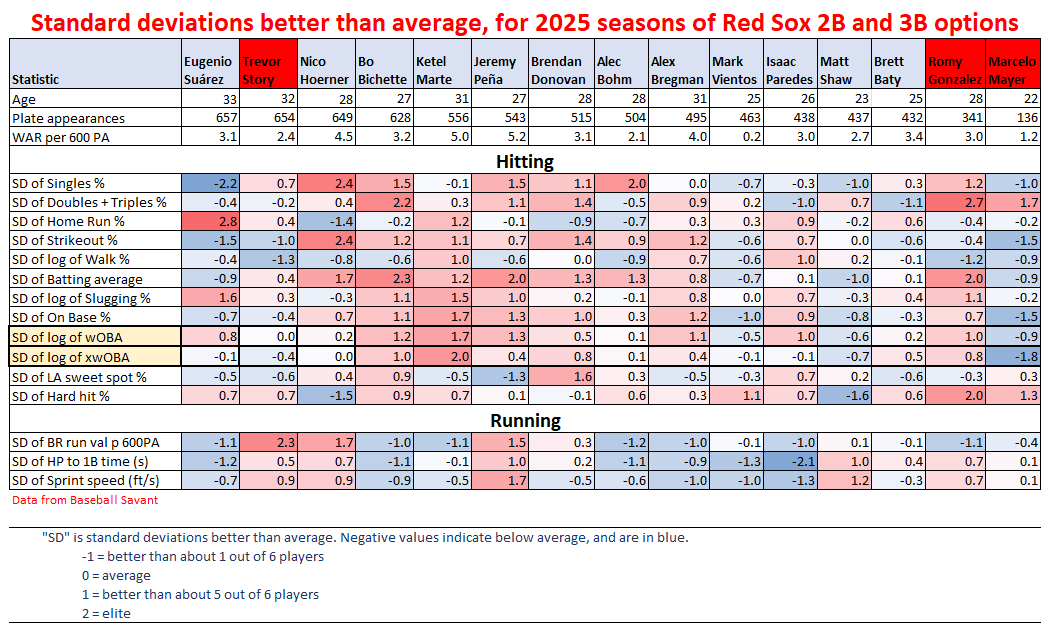
Note in the top section I added a WAR per 600 plate appearances line. This WAR is the average of the Baseball Reference WAR, the FanGraphs WAR, and Baseball Prospectus’ WARP. I then scale it to what it would have been had the player accumulated WAR at the same rate through the season, and had 600 plate appearances. This makes it more like a rate stat, and I feel it makes for a better comparison for players with varying amounts of playing time.
I also added a line in the Running section for Baserunning Run Value per 600 plate appearances. This starts with the Statcast Baserunning Run Value numbers, which combines the run value of extra bases attempted and the run values of stolen base attempts. I then scale to 600 plate appearances so that players with less playing time don’t get shoved to the middle of the pack. Trevor Story, Nico Hoerner, and Jeremy Pena all excelled here, and they’re all fast runners. Seven players were duds at baserunning; six of those are slow runners; the other one, Romy Gonzalez, is actually a fast runner. He needs to work on his baserunning game.
Despite that, I honestly think that Romy Gonzalez is the best overall infielder the Red Sox have right now. I would have expected to tell you it was Trevor Story, but I am surprised how poorly his numbers show here. He did have a big early-season slump with the bat, so maybe I should assume better 2026 numbers at the plate for him. The biggest surprise was defense – not a lot of errors, but very poor metrics for runs prevented. Perhaps he was less daring after all the injuries over the previous 3 years. Absolutely great on the basepaths, which was nice.
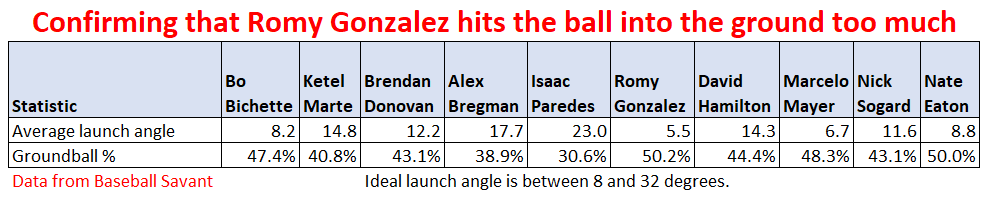
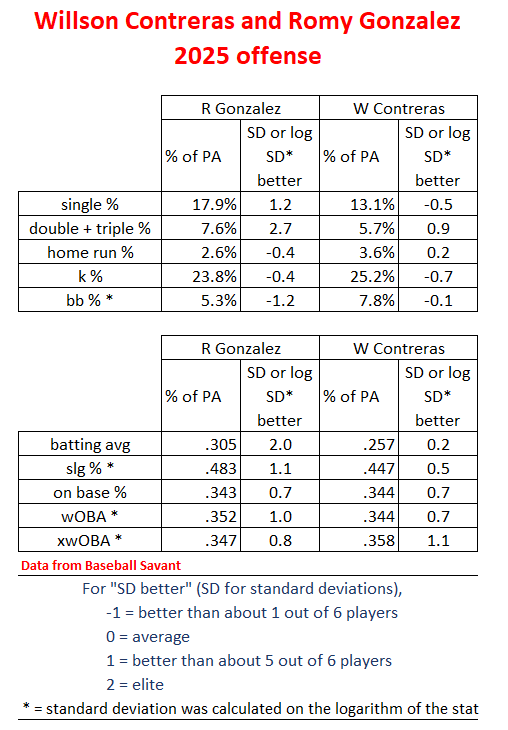
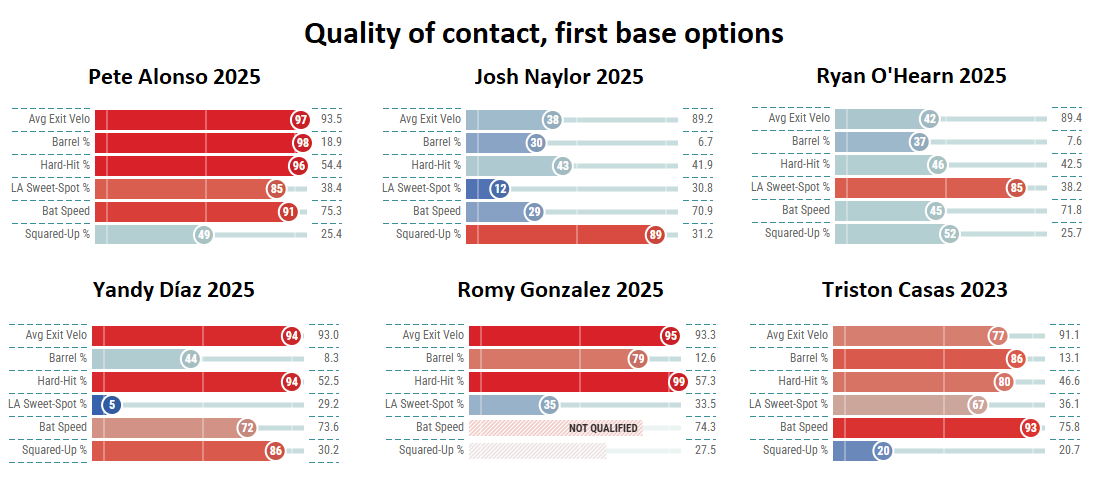
Romy, though poor on the basepaths, and average on defense, blossomed at the plate to produce the second best results on the team there, behind only Roman Anthony. It was the payoff for some intense offseason work with a good hitting coach. What really stands out is the elite hard-hit rate (5th best in the MLB, behind Anthony, Schwarber, Judge, Ohtani). This was tempered by a very low launch angle and very high ground ball rate. There is potential here for a breakout season in 2026.
Marcelo Mayer similarly had a very good hard-hit rate tempered by a low launch angle (well Roman Anthony did, too, actually), but in terms of overall results at the plate, besides a good rate of doubles (Fenway can do that for you), in every other way his results at the plate were poor. Good-not-great defense, okay baserunning. Right now I consider him “unproven” as a major leaguer. Most fans seem to assume he’ll be a regular and Romy Gonzalez should be the bench/utility guy, but I want to see more from Mayer before I’d consider him “regular starter” material.
So what about the possible imports? Jeremy Pena is a name I heard mentioned – he definitely tops the list in terms of overall value. I don’t know how realistic it would be to acquire him, but he looks like a real solid 5-tool guy in his prime. He’d knock Trevor Story out of the shortstop position.
Nico Hoerner, a second baseman, is the top defender on this list, just outstanding, and one of the best baserunners, too. He puts the ball in play and gets a lot of singles, but has no power. The least of anyone on this list.
Brett Baty, who plays 2B and 3B, is perhaps the most balanced of the rest, good at everything, great at nothing. Average bat and baserunning, above average defense.
Eugenio Suarez is perhaps the most imbalanced of the rest. He does one thing well: mash home runs. But he does that exceptionally well. Worst at singles, okay at doubles, lots of strikeouts. Poor baserunner, very poor fielder. Yet still valuable for the home runs. How will his bat play in Fenway, though?
Isaac Paredes has a strong bat; lots of home runs, good numbers for walks and strikeouts, though his low expected wOBA says he may have been lucky in 2025. And his bat is tempered by poor baserunning and poor defense at 3B.
Brendan Donovan, a second baseman, has a very good overall bat that lacks power. Good/okay baserunning, substandard fielding.
Alec Bohm, a third baseman, is similar. Average or slightly above average bat with no power. Poor baserunning, okay fielding.
Matt Shaw is young – was just 23 last year, a rookie. He’s fast, and provided excellent third base defense. His bat didn’t live up to expectations, but that happens in rookie years. He showed some power, was average with strikeouts and walks, but a low batting average, slug, and OBP. His value comes in whatever faith there is that his bat will develop. He could become very good.
The last one on the list is Mark Vientos. I’m not sure why he’s considered an option. Oh, I see, he had one good season in 2024. But going by 2025, he’s got some pop to his bat, but brings nothing else to the table. Low OBP, low overall bat value, slow, poor defense at third base. He doesn’t bring an improvement over any of the existing Story-Mayer-Gonzalez trio. There’s no point in acquiring this guy.
In the end, here would be my reaction to the Red Sox acquiring one of these guys:
Jeremy Pena: Enthusiastic yes.
Nico Hoerner: Good with this.
Matt Shaw: Probably good with this.
Baty, Suarez: Maybe good with these.
Paredes, Donovan, Bohm, Vientos: No thank you.
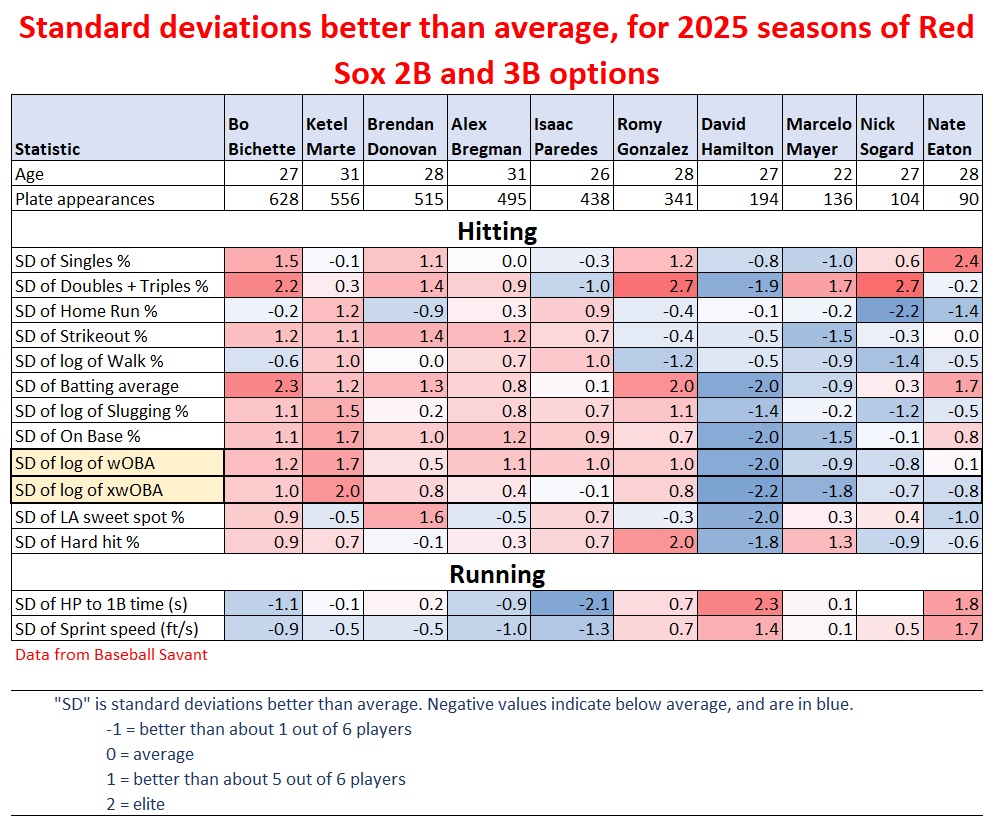
Here are the same stats for hitting and running presented in terms of standard deviations from the mean.