To succeed as a baseball player in Boston, you have to have a way of dealing with the scrutiny of the fan base. This and what follows are things I think are true, but couldn’t prove to you. Consider it all well-considered opinion.
I think there are two personalities that can handle this well. I’ll call them the Cool Type and the Hot Type.
The Cool Type is calm, cool, and collected. Nothing fazes them. Criticism just slides right off like they don’t hear it. They succeed by shutting out the noise. On the Red Sox, this is Marcelo Mayer, Roman Anthony, Ranger Suarez, and maybe Masataka Yoshida.
The Hot Type is energetic and unapologetic. They hear the noise, and they feed off its energy, often even when the noise is critical of them. On the Red Sox, this is Willson Contreras, Wilyer Abreu, Peyton Tolle, and now Anthony Seigler too.
Other players who aren’t either type may succeed by following the lead of their Hot Type or Cool Type teammates.
All players will have some ability to shut out bad noise and feed off good noise. It’s just that some fit one archetype better than the other, and then that’s what everyone around them sees.
I think a team can succeed with a mixture of both types. Hot Types bring the energy when things are feeling lackluster. Cool Types provide the even keel when things are rough, the “everything’s going to be alright” mindset when worry sets in and potentially becomes self-defeating.
This year the Cool Types weren’t doing much. When Anthony Seigler showed up in June, I think the Hot Types reached a critical mass, and things took off. It helps that many players around them play with a lot of energy – Durbin, Duran, and now Cheng too. Rafaela plays with energy when it’s called for too, but the rest of the time seems to have that calm demeanor as well. Hard to place him.
Regardless, I think part of the magic of this run is that every position player on this current roster responds well to Hot Type leadership that Willson Contreras and others are providing. They’re feeding off all the energy around them, and no place provides more energy than a full Fenway Park when their Red Sox are on a winning streak and surging in the standings.
I don’t think Mayer and Anthony necessarily have an attitude problem, as some people are suggesting, just because they don’t fit the current clubhouse chemistry. They’re just a different type than what’s working so well for the Red Sox right now. Not saying the attitude problem isn’t there, either. It’s possible the whole “Big 3” thing went to their heads too much. But let’s not jump to that conclusion too hastily. For now, Hot is working for the Red Sox, but they may need to bring back some more Cool later on to get the best balance.
Two weeks ago I published How the Boston Red Sox could be an unlucky .500 team. It showed that if you randomly scramble up the Red Sox runs scored numbers from all their 2026 games, they would almost always end up with a few more wins than the 31 they actually had. Most typically, they’d be just under .500 for a winning percentage.
That article goes into detail about the thinking behind this analysis, and how it works.
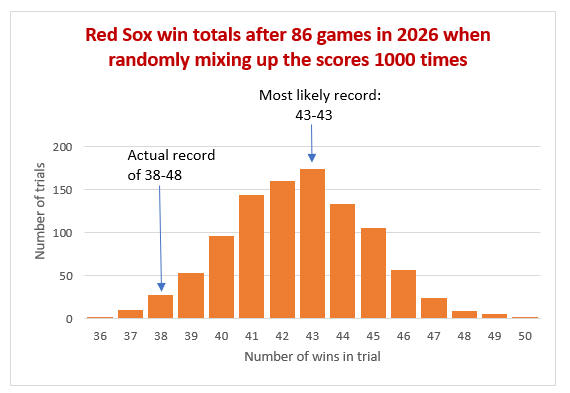
It’s 2 weeks later now, and the Red Sox have done a bit more winning than losing in that time. I thought I’d check to see what their updated chart looks like. And here it is, through Friday’s opener against the Angels on July 3:
When randomly rearranging their scores, over 96% of the trials gave the Red Sox a better record than their current 38-48. The most likely outcome was an even .500 record of 43-43. 33.4% of trials were above .500, while 49.2% were below .500.
The Pythagorean Win-Loss formula also predicts a 43-43 record for the Red Sox.
So either the Red Sox have been unlucky this year, and are better than their record, or they’re just poor at winning close games.
The Boston Red Sox offense has been up and down this year, but on the whole seems not bad. Their pitching has been very good this year. So has their defense.
So why do they have such a bad record of 31-43 (through the games of Saturday, June 21)?
I’ve noticed there are a lot of games where they come close, but fall just a little short. Sometimes the pitching is there, but the offense isn’t quite enough. Then the offense picks up, but at the same time the pitching falters. Could this be just a case of bad timing? Had they achieved the same game run totals, but just in different games, would the results be about the same, or better, or worse?
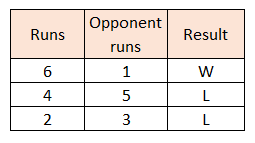
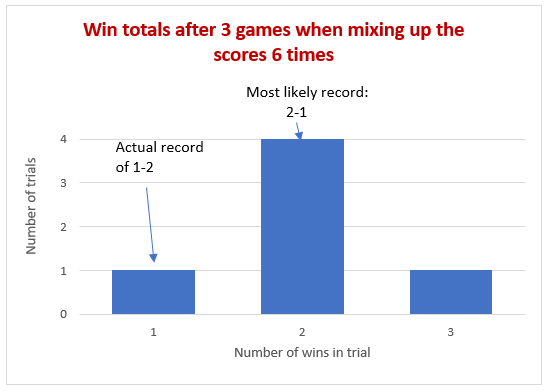
To be sure I’m conveying what I mean correctly, here’s an example. Suppose a team has played 3 games so far in a new baseball season. Their results are as follows:
Their record is 1-2. But it seems they’re playing better than their record – their losses are close, their win is not. They have more runs scored than allowed, overall.
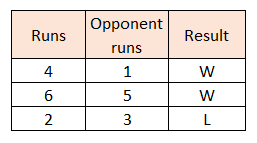
What if the 6-run game had happened when their opponent scored 5 runs? They’d have won that game then. Swapping those first two scores earns them an extra win:
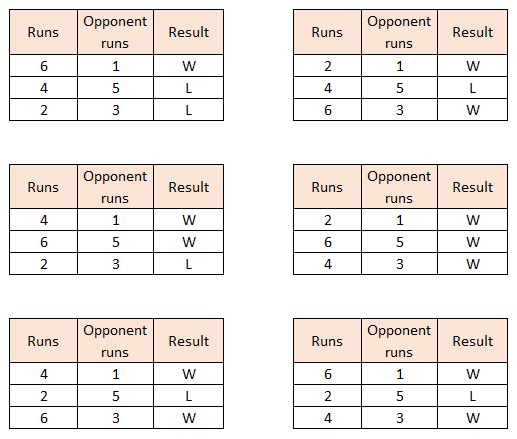
Well that’s interesting. The same performances in a different order gives a different win total. What if we continue this practice? Here are all six orderings that can be done:
In every alternative ordering, this team gets more wins. In one ordering, they even win all their games! But in most, then have a 2-1 record. Here’s a histogram showing how often each record occurs among the different reorderings:
83% of outcomes are better than their actual record.
Of this team, I would say one of two things. Either they have been unlucky so far, or they have done a poor job at winning close games.
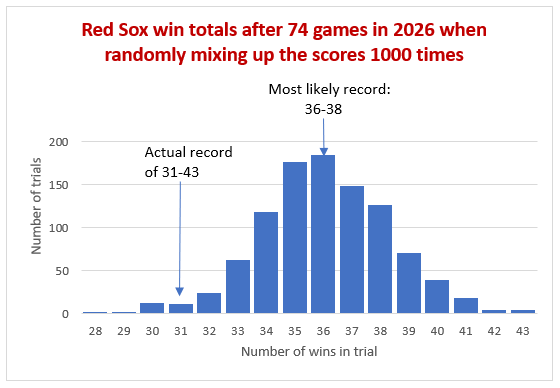
We can do basically this same analysis on the 2026 Boston Red Sox, but because they have 74 games played instead of 3, we can’t calculate the win-loss totals for every possible reordering of their games. The number of different reorderings of 74 games is a huge number, it’s a number with 108 digits. If all the computers on Earth worked together generating those reorderings and evaluating the number of wins for each, and continued working on it for the entire age of the universe, they would barely scratch the surface of the problem.
Fortunately, we can get a good idea of the shape of things by random sampling. While holding the opponents’ scores in their original order, I randomly reordered the Red Sox scores, and counted win totals. And to ensure apples-to-apples comparisons, I did not use end-of-game scores for extra innings games; I always used the score at the end of nine innings. This could still create some imbalance in games where the home team wins after 8 ½ innings or so, but I did not try to compensate for that.
When I got a tie result, I split those results 50/50 – half wins, half losses. This led to some trials producing fractional win totals, such as 33.5. To keep the results to whole numbers of wins and losses, every fractional win total got its count split evenly between the whole number above it, and the whole number below it. For example, there were 42 trials that had a win total of 33.5. So 21 of those trials got counted as 33-win trials, and 21 of them got counted as 34-win trials.
After doing all that, here is a histogram of the results:
Their actual record is down at the lower end of this. Only 2.6% of trials resulted in 31 or fewer wins. That means 97.4% of outcomes were better than their actual record.
18.5% of trials resulted in the most likely win total of 36. This is just one win shy of a .500 record.
Interesting note: there is a formula called “Pythagorean Win-Loss” that predicts what a team’s record ought to be based on its total runs scored and runs allowed. While using less information than the process I described above, it produces the same prediction of a 36-38 record. You can look it up on Baseball-Reference.
But I can draw a few more conclusions. Such as that 59% of outcomes had the Red Sox with a losing record; 15% had them with a .500 record; and 26% had them with a winning record. So there is a greater than 1 in 4 chance that the Red Sox would have a winning record right now, and more than a 2 in 5 chance they would not be a losing team, if their run totals had just happened in a different order this year.
I draw the same conclusion for these 2026 Red Sox as I did for the example above: either they have been unlucky so far, or they have done a poor job at winning close games. My guess is a little of both. That they’re an unlucky team that nonetheless has some fundamental things to work on if they want to be a playoff-caliber team.
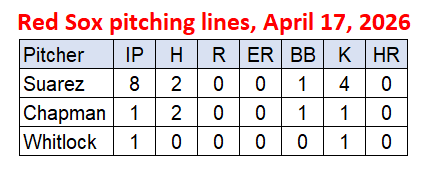
Friday night (April 18, 2026) the Boston Red Sox got a thrilling 1-0 win in 10 innings over the Detroit Tigers.
Which pitcher did the most to help them win?
Here are the stat lines of their 3 pitchers in this game:
It should be clear that Ranger Suarez’s 8 shutout innings did more to help the Red Sox win than did Aroldis Chapman’s and Garrett Whitlock’s 1 shutout inning apiece.
But the win went to Whitlock, not Suarez.
This happens a lot, in my opinion. Too much. So many pitchers who deserve the win don’t get it, because of rules made in 1950 to finally consolidate all the competing standards for which pitcher should get the win. And when the top pitchers were still the only pitcher to pitch in the game for their team, in most of their starts. Changes in the game have made the use of relief pitchers an every-game occurrence, and have exposed the unfairness of these rules.
First we determine how many runs per inning the Red Sox scored in the game. The scored their 1 run with one out in the 10th inning, so that’s 1 run over 9 ⅓ innings, or 3/28 runs per inning, or about .107 runs per inning.
Now we credit each Red Sox pitcher in the game with that many runs per inning they pitched.
Pitcher
Runs credited for innings pitched (RC)
Ranger Suarez
8 IP x 3/28 = 24/28 or .857 runs
Aroldis Chapman
1 IP x 3/28 = 3/28 or .107 runs
Garrett Whitlock
1 IP x 3/28 = 3/28 or .107 runs
Now from this we subtract the actual runs each pitcher allowed in the game.
Pitcher
Runs Credited (RC)
Runs allowed (R)
Runs Ahead (RA)
Ranger Suarez
.857
0
.857
Aroldis Chapman
.107
0
.107
Garrett Whitlock
.107
0
.107
This gives a number for each pitcher called “Runs Ahead”. In this case, because no runs were given up by any Red Sox pitcher in Friday’s game, it’s the same as the Runs Credited for innings pitched for each pitcher.
The win then simply goes to the pitcher with the greatest number of Runs Ahead. In this case, it goes to Ranger Suarez, who as we decided before, did the most to help the team win the game.
Notice that the calculation of Runs Ahead is based on only two numbers – runs allowed, and innings pitched. That was a deliberate choice. These numbers are the only two real contributions a pitcher makes toward the goal of winning or losing a game. All other stats may describe how the pitcher gets to that goal, but only these two record progress toward the goal.
It’s a method that, I believe, will most closely align with the judgement “which pitcher did the most to help his team win the game”. I’d like to see it replace the current flawed methods. And then Ranger Suarez can get his win back.
Here are some other previous posts I’ve made about this method.
Serves me right for basing an analysis on media rumors.
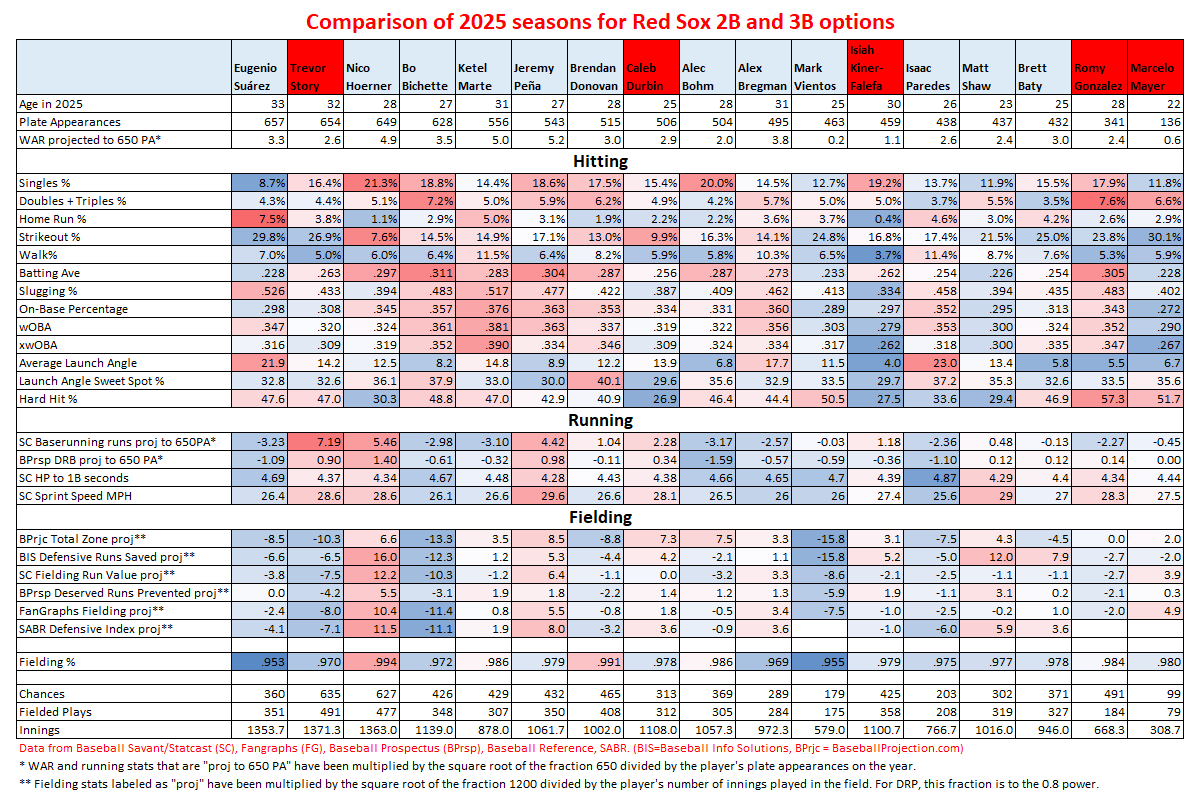
In two previous posts (here and here), I compiled hitting, baserunning, and defense statistics for every 2B/3B/SS candidate the Red Sox were connected with this offseason by various news articles. One possibility that never came up in those articles was Isiah Kiner-Falefa, so I didn’t include him. So of course that’s who the Red Sox sign. So I started creating this update to my previous comparisons, to include him.
That’s when things really got weird.
In rapid succession, the Red Sox claimed infielder/catcher Mickey Gasper off waivers, then infielder Tsung-Che Cheng, then infielder Brendan Rodgers, then traded infielder David Hamilton and two pitchers to the Brewers for infielder Caleb Durbin, infielder Andruw Monasterio, and infielder Anthony Seigler. That’s 7 new infielders with major-league experience acquired in a 6-day span, none of whom I’d provided any analysis for previously. So, I needed to do some serious updating. (And Red Sox prognosticators in the media need to seriously update their prognosticating game, because they were all very wrong.)
It took me a while, but here it is finally. I added the two who are likely to stay on the major league roster to the comparison of acquisition options. I’ve added all of them (except for Tsung-Che Cheng, who has played only 3 games in the majors) to a comparison of actual Red Sox infielders. I kept David Hamilton in that comparison, for now.
About this chart
Numbers that are red are above average, the redder the better. Numbers in white are average. Numbers in blue are below average, the bluer the worse.
As before, the order was chosen based on number of plate appearances in 2025. Most on the left, least on the right. I made the header red for players currently on the Red Sox.
The WAR number has changed a bit. As before, “WAR” refers to the average of the Baseball Reference WAR, the FanGraphs WAR, and Baseball Prospectus’ WARP. But my projection to 650 plate appearances is not done by simply assuming each player would accumulate WAR at the same rate they did in their smaller number of plate appearances. There is a good reason for this. There is always some randomness in the results; some would refer to it as luck. While players with more plate appearances will see bigger swings in their totals due to luck, the size of those swings will be a smaller fraction of their overall numbers. So I switched from multiplying players’ WAR by
To multiplying by
This ensures the scaled up effects of luck are not bigger for players with low PA than they are for players with 650 PA, even though it likely underestimates what their full-year contribution would have been based on actual talent.
I made the same adjustment for the first two baserunning stats.
For fielding stats, the adjustment was to multiply by
The one exception was for DRP, where the folks at Baseball Prospectus seem to have done some adjusting already. For this, the best adjustment worked out to be multiplying by
The Charts – comparing to other offseason targets
Here are the current top Red Sox “non-first-base” infielders (with red headers) compared to other players mentioned as potential offseason acquisitions.
Here are the same stats expressed in standard deviations from the average. These numbers provide a standard way of telling how good a player’s stat is compared to the rest of the players in the MLB. (It also doesn’t suffer the problem that percentiles has, which is that what looks like a big difference for players average numbers looks like a small difference for players with the best or worst numbers. Although with the log-normal distributions, what looks like a big difference among the worst players will look smaller among the best players, though the effect is not expected to be as pronounced.)
First thing to note is that Kiner-Falefa is the worst hitter in this list. He looks like what Marcelo Mayer was in 2025, but with less power and a low strikeout rate. And Mayer is expected to get better. Kiner-Falefa gets a very high rate of singles; an average amount of doubles; a low strikeout rate, for a good batting average. But his extremely low walk and home run rates tanks the value of his bat. If they need a guy to put the ball in play, he’s a good choice. Otherwise, his bat has little value.
Caleb Durbin, on the other hand, had pretty much a league-average bat in 2025, with a very low strikeout rate. As he was a rookie, we can look for there to be improvement going foreward. His launch angle and hard hit numbers show there’s some room for improvement in squaring up the ball.
Durbin’s baserunning was above average; it’s about the 4th best on this list of 17 players. Kiner-Falefa’s was average or just above average.
Durbin was one of the top 5 fielders on this list, solidly above average. Kiner-Falefa’s fielding, as with baserunning, was more average or a little above average. Durbin played almost exclusively at third base, so it’s hard to say how he’d do elsewhere. Kiner-Falefa has played many positions in his career, and shortstop more than anywhere else, although as a fielder he’s been much better at second and third. He’s also a good outfielder. He’s even caught a lot in his career, though he’s not good at it.
On the whole, the Red Sox did well in picking up Durbin. He’s pretty much better in every way than Kiner-Falefa, and compares well to the other players on this list who fans coveted. He’s a 3-tool guy who could grow into being a 4 or 5 tool guy, if his bat improves. Definitely starter material, and young and controllable.
More charts – comparing to other Red Sox infielders
Here are the charts comparing all the new guys – Caleb Durbin, Isiah Kiner-Falefa, Andruw Monasterio, Anthony Seigler, Brendan Rodgers, and Mickey Gasper (leaving out Tsung-Che Cheng as he only played in 3 games) – to existing Red Sox infielders Trevor Story, Romy Gonzalez, Marcelo Mayer, Nick Sogard, Nate Eaton, and even Kristian Campbell (though I don’t think his 2025 is representative of who he will be – well you could say the same of Mayer). I’m keeping David Hamilton in for now, for comparison purposes. Again, this leaves out the first basemen.
By my judgement, the top three in this bunch are Trevor Story, Romy Gonzalez, and Caleb Durbin. Until Marcelo Mayer is more major-league ready, I would want to see those three get the lion’s share of the playing time.
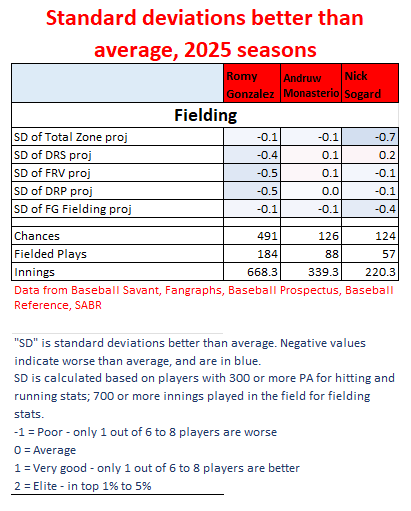
There is an interesting comparison to be made between newcomer Andruw Monasterio and incumbent utility guys Romy Gonzalez and Nick Sogard. I’ll go into that in a little depth below. But first, here are a few quick notes about the other guys.
Some quick observations
The guy they gave up, David Hamilton, was the best defender of the bunch. He was also one of the three best baserunners. His bat was poor, but I had the feeling that it would have been better with regular playing time. We must remember that with more playing time in 2024, he had a league-average bat. His good launch angle gives him occasional pop.
Andruw Monasterio’s numbers look really close to Nick Sogard’s, with slightly better defense and more pop in his bat. It makes him an overall more valuable player, and they are close in age. Sogard’s a solid, hard-nosed backup player, but he could see less time on the roster now.
Brendan Rodger’s bat was not good, but historically it has been better. He especially has had good numbers against lefties, and that could get him some playing time on this roster that just lost lefty-mashers Rob Refsnyder and Alex Bregman.
Mickey Gasper was just awful. Anthony Seigler’s bat was not good. These guys are depth options only. Hoping we don’t see them in the majors, unless they somehow get better.
Nate Eaton is a very intriguing player. He may be primed for a breakout season. We’ll see.
Not sure what to expect from “Big 3” alums Kristian Campbell and Marcelo Mayer. Hopefully one of them turns the corner in 2026.
Gonzalez/Monasterio/Sogard similarities
The top 5 lines of the hitting section of the chart break down the rates at which the hitters get different outcomes. Look at how similar those are for Romy Gonzalez, Andruw Monasterio, and Nick Sogard. Hang on, let me put together a version of the chart that has just those three players:
Those are very similar numbers in those top 5 hitting lines for singles, doubles & triples, home runs, walks, and strikeouts. Andruw Monasterio hits like Nick Sogard with more pop, and like Romy Gonzalez with fewer singles (his doubles numbers are a bit lower, but they should get boosted by Fenway Park, so I’ll consider them all equal there).
They’re all similar in age.
They’re all well-below-average baserunners despite having average to above-average speed.
Monasterio stands out a bit on defense, though. While the numbers for their defensive metrics seem to be saying that Monasterio is a little above average defensively while Gonzalez and Sogard are a little below average, if we look at my chart that expresses these defensive metrics as standard deviations above or below average, we see it saying that Monasterio is average, while Sogard and Gonzalez are below average;
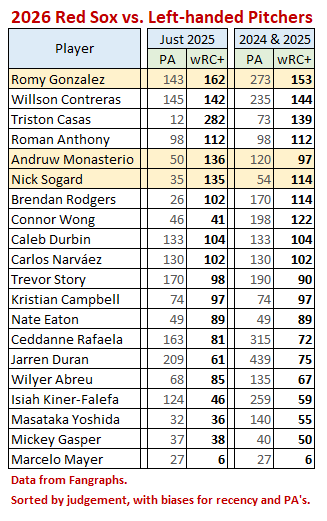
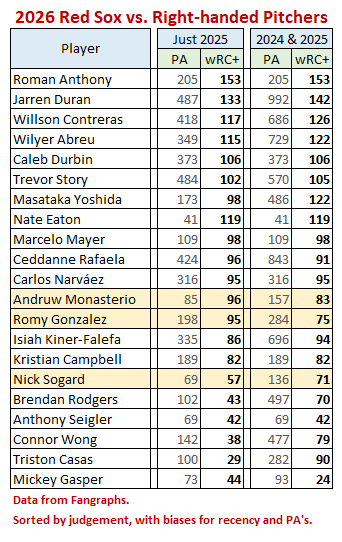
They are also all strong against left-handed pitching. While Sogard is a switch hitter and the other two are righties, their platoon splits are those of right-handed hitters. Here are tables of current Red Sox position players against LHP and RHP:
While Gonzalez is the clear leader against lefties, they’re all (at least recently) well above average against them. Gonzalez and Monasterio are approaching average against righties, with Sogard a good bit behind them.
All told, Andruw Monasterio represents an upgrade over Nick Sogard, and a good alternative to Romy Gonzalez, should Gonzalez not be fully recovered from injury by opening day. While fans may appreciate Sogard’s solid if unspectacular play, I expect they’ll be seeing less of him on the field for the Red Sox going forward.
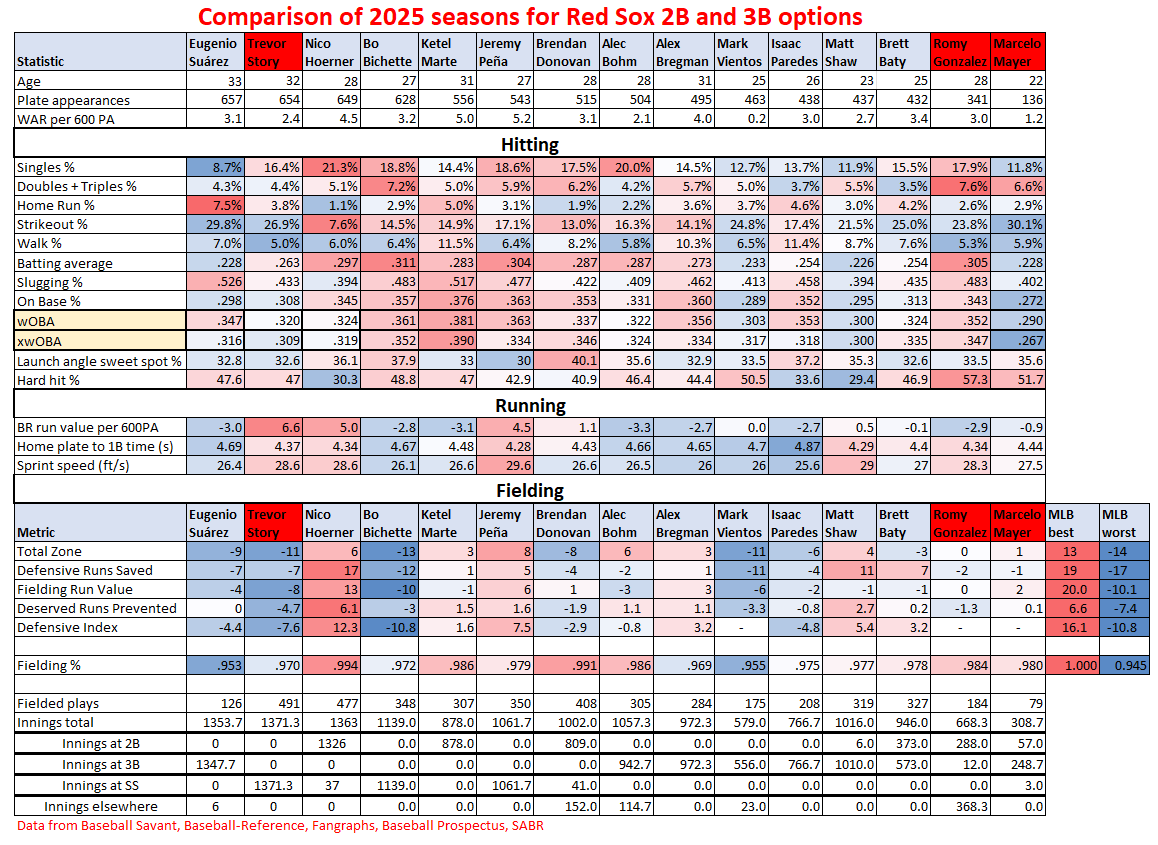
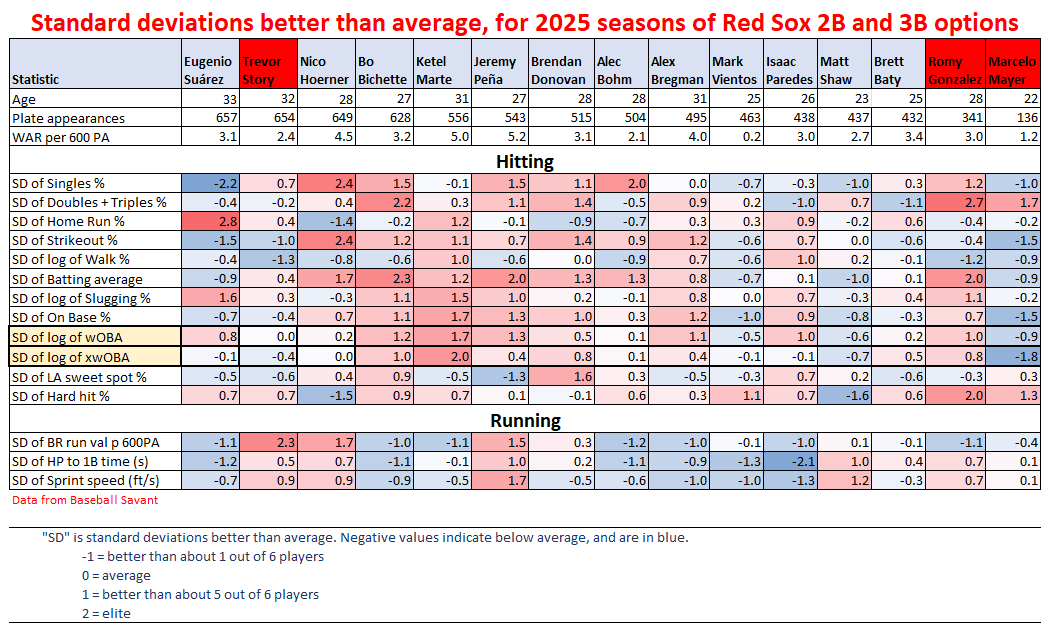
Three weeks ago I posted charts comparing the 2025 seasons of players that, at least in the press, were being considered as options for the Red Sox to play at second base and/or third base in 2025. Most of these players not currently being part of the organization. Much has changed these past 3 weeks, and so an update was called for. Below find the updated chart with new players added, some utility players removed, and a couple of extra stats added to make the picture a bit more complete. I’ve kept Alex Bregman, Bo Bichette, and Ketel Marte on the list even though they are no longer options, just to serve as reference points. I’ve also highlighted names of players currently on the Red Sox in red.
As before, the order was chosen based on number of plate appearances in 2025. Most on the left, least on the right.
Note in the top section I added a WAR per 600 plate appearances line. This WAR is the average of the Baseball Reference WAR, the FanGraphs WAR, and Baseball Prospectus’ WARP. I then scale it to what it would have been had the player accumulated WAR at the same rate through the season, and had 600 plate appearances. This makes it more like a rate stat, and I feel it makes for a better comparison for players with varying amounts of playing time.
I also added a line in the Running section for Baserunning Run Value per 600 plate appearances. This starts with the Statcast Baserunning Run Value numbers, which combines the run value of extra bases attempted and the run values of stolen base attempts. I then scale to 600 plate appearances so that players with less playing time don’t get shoved to the middle of the pack. Trevor Story, Nico Hoerner, and Jeremy Pena all excelled here, and they’re all fast runners. Seven players were duds at baserunning; six of those are slow runners; the other one, Romy Gonzalez, is actually a fast runner. He needs to work on his baserunning game.
Despite that, I honestly think that Romy Gonzalez is the best overall infielder the Red Sox have right now. I would have expected to tell you it was Trevor Story, but I am surprised how poorly his numbers show here. He did have a big early-season slump with the bat, so maybe I should assume better 2026 numbers at the plate for him. The biggest surprise was defense – not a lot of errors, but very poor metrics for runs prevented. Perhaps he was less daring after all the injuries over the previous 3 years. Absolutely great on the basepaths, which was nice.
Romy, though poor on the basepaths, and average on defense, blossomed at the plate to produce the second best results on the team there, behind only Roman Anthony. It was the payoff for some intense offseason work with a good hitting coach. What really stands out is the elite hard-hit rate (5th best in the MLB, behind Anthony, Schwarber, Judge, Ohtani). This was tempered by a very low launch angle and very high ground ball rate. There is potential here for a breakout season in 2026.
Marcelo Mayer similarly had a very good hard-hit rate tempered by a low launch angle (well Roman Anthony did, too, actually), but in terms of overall results at the plate, besides a good rate of doubles (Fenway can do that for you), in every other way his results at the plate were poor. Good-not-great defense, okay baserunning. Right now I consider him “unproven” as a major leaguer. Most fans seem to assume he’ll be a regular and Romy Gonzalez should be the bench/utility guy, but I want to see more from Mayer before I’d consider him “regular starter” material.
So what about the possible imports? Jeremy Pena is a name I heard mentioned – he definitely tops the list in terms of overall value. I don’t know how realistic it would be to acquire him, but he looks like a real solid 5-tool guy in his prime. He’d knock Trevor Story out of the shortstop position.
Nico Hoerner, a second baseman, is the top defender on this list, just outstanding, and one of the best baserunners, too. He puts the ball in play and gets a lot of singles, but has no power. The least of anyone on this list.
Brett Baty, who plays 2B and 3B, is perhaps the most balanced of the rest, good at everything, great at nothing. Average bat and baserunning, above average defense.
Eugenio Suarez is perhaps the most imbalanced of the rest. He does one thing well: mash home runs. But he does that exceptionally well. Worst at singles, okay at doubles, lots of strikeouts. Poor baserunner, very poor fielder. Yet still valuable for the home runs. How will his bat play in Fenway, though?
Isaac Paredes has a strong bat; lots of home runs, good numbers for walks and strikeouts, though his low expected wOBA says he may have been lucky in 2025. And his bat is tempered by poor baserunning and poor defense at 3B.
Brendan Donovan, a second baseman, has a very good overall bat that lacks power. Good/okay baserunning, substandard fielding.
Alec Bohm, a third baseman, is similar. Average or slightly above average bat with no power. Poor baserunning, okay fielding.
Matt Shaw is young – was just 23 last year, a rookie. He’s fast, and provided excellent third base defense. His bat didn’t live up to expectations, but that happens in rookie years. He showed some power, was average with strikeouts and walks, but a low batting average, slug, and OBP. His value comes in whatever faith there is that his bat will develop. He could become very good.
The last one on the list is Mark Vientos. I’m not sure why he’s considered an option. Oh, I see, he had one good season in 2024. But going by 2025, he’s got some pop to his bat, but brings nothing else to the table. Low OBP, low overall bat value, slow, poor defense at third base. He doesn’t bring an improvement over any of the existing Story-Mayer-Gonzalez trio. There’s no point in acquiring this guy.
In the end, here would be my reaction to the Red Sox acquiring one of these guys:
Jeremy Pena: Enthusiastic yes.
Nico Hoerner: Good with this.
Matt Shaw: Probably good with this.
Baty, Suarez: Maybe good with these.
Paredes, Donovan, Bohm, Vientos: No thank you.
Here are the same stats for hitting and running presented in terms of standard deviations from the mean.
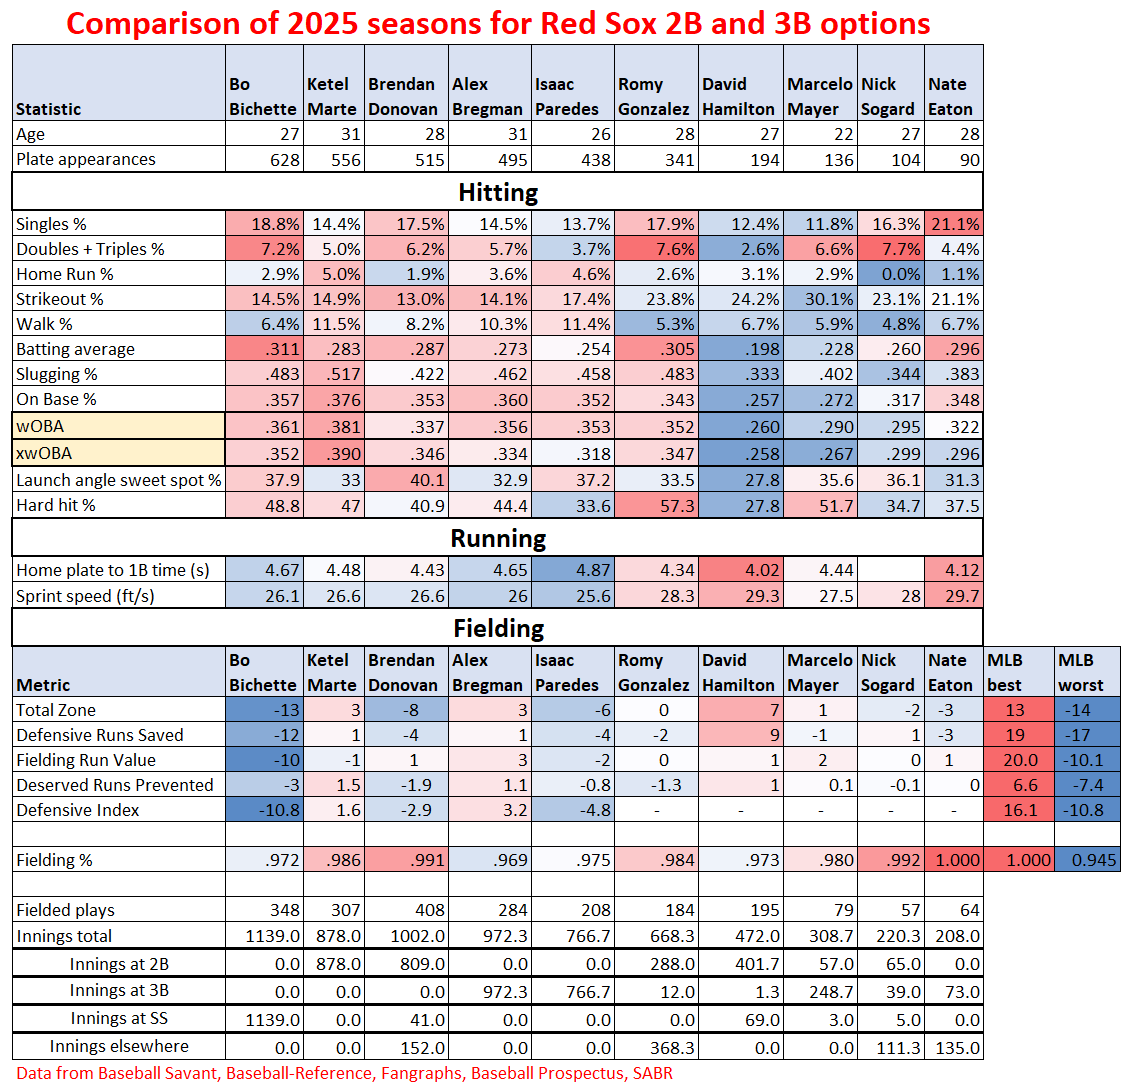
A lot of names have been mentioned as possible second basemen or third basemen for the Boston Red Sox in 2026. Some are already on the roster (Marcelo Mayer); some could be added by trade (Ketel Marte, Brendan Donovan); some could be picked up as free agents (Bo Bichette, Alex Bregman).
There are other names on the current Red Sox roster that have played significant time at second and/or third base, but are not mentioned in articles about who will get regular playing time in the Red Sox infield. And I have issues with this. Specifically, I have issues every time I read that Marcelo Mayer is presumed to be the player who will round out the infield after they acquire a second or third baseman. Because when I look at what Romy Gonzalez did in 2025, I see a guy who is no longer a platoon player, he’s a guy that deserves to play every day. In addition to that, his elite hard-hit rate makes him a breakout candidate, and I’m saying that despite the fact that he was already the second-best hitter on the Red Sox in 2025. His defense is not bad, it’s good enough, and his baserunning is a plus. He’s proven at the major league level, in ways that Marcelo Mayer isn’t. He can be relied on to produce good results in ways that Marcelo Mayer can’t yet.
The thing that will allow him to break out? If he just stops hitting the ball into the ground so much. Of all the guys I’m comparing in this article, he does that the most. His average launch angle is the lowest. The result is that he’s one of the best in baseball at hitting doubles and triples, but his rate of home runs is a little below average.
He could also stand to chase less, and correspondingly increase his walk rate while decreasing his strikeout rate.
If you care about home runs, stikeouts, and walks, any of the 5 potential acquisitions (Bichette, Marte, Donovan, Bregman, Paredes) will be an improvement over Romy Gonzalez. But if you care about overall results at the plate, only Ketel Marte is looking like an improvement over Gonzalez. And when you factor in fielding and baserunning, there are some even bigger advantages for Gonzalez over most of these 5.
I’d hoped to discuss more specifics about comparisons of individual players, but I am finding it hard to find time to write this article. So I’ll just show you the tables I created to make these comparisons easy.
Here are the comparisons I’ve created for these players. The players are ordered left to right by most plate appearances in 2025.
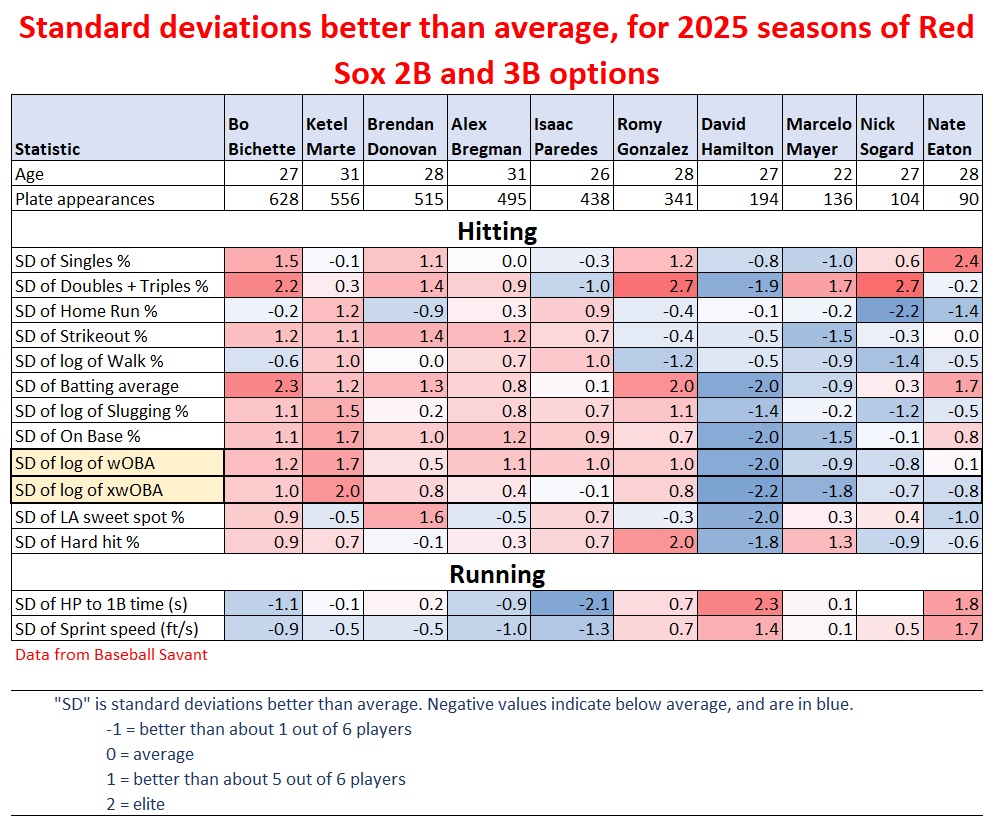
Red means the number is above MLB average; blue means it’s below MLB average. White is MLB average. I set the deepest red to 2.8 standard deviations better than the mean (usually above, but sometimes below), and the deepest blue to 2.8 standard deviations worse than the mean. For hitting and baserunning, a table showing the numerical values of these standard deviations follows.
These same statistics expressed as standard deviations better (red) or worse (blue) than MLB average is below. In some cases, the data was more log-normal than normal, so I used standard deviations of the logarithm of the stat. These are labeled as such.
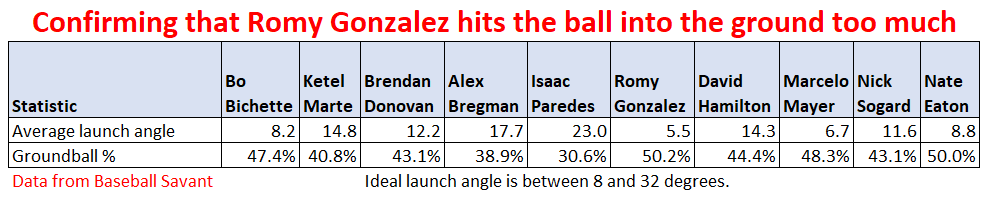
Here are the numbers supporting my previously mentioned statement that Romy Gonzalez can unlock a lot more power if he learns to elevate the ball. He hits it into the ground too much.
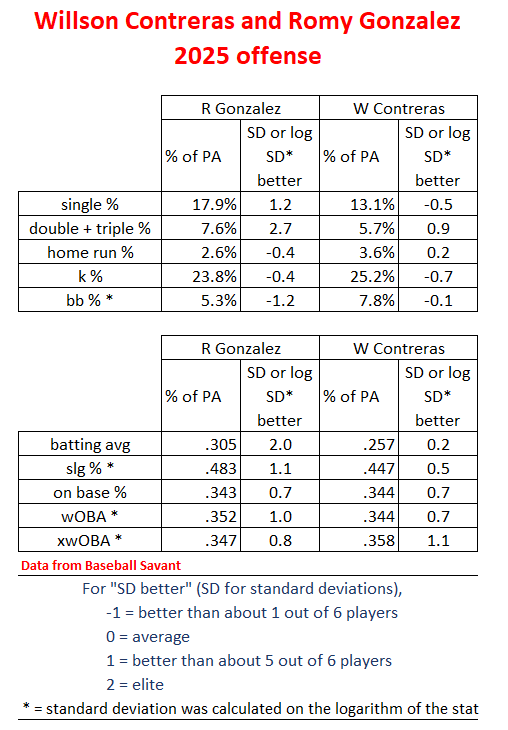
I hated the trade of Willson Contreras to my team, the Boston Red Sox, for RHP Hunter Dobbins, RHP Yhoiker Fajardo and RHP Blake Aita. The Red Sox got a good player who doesn’t improve the team, while giving a player who was a personal favorite.
Hunter Dobbins was my favorite pitcher on the Sox, not for how he pitched, but for the things he said. For the competitive fire. For the anti-Yankees fervor. He seemed promising as a #5 starter.
When I say that Willson Contreras doesn’t improve the Red Sox, that hinges on something that I get the feeling that nobody agrees with me on: that Romy Gonzalez has evolved into one of the top bats on the team, whose elite hard-hit rate could turn him into one of the top bats in the game if he could learn to elevate the ball a bit (he hits it into the ground too much). If you go by multi-year track record, people are right about Gonzalez and Contreras; but if you go just by 2025, as I do in my comments to follow, they’ve got Romy all wrong.
I’ve stated elsewhere, when you analyze it carefully, you see that Contreras is no better than Romy Gonzalez at first base. He’s a good player that the Red Sox didn’t need.
A key part of that statement is “at first base”. Romy’s best position defensively has always been first base, where he rates as average by all the different rating systems (he’s a below average fielder everywhere else). Contreras is effectively the same as Romy at 1B in Total Zone, Defensive Runs Saved, and Deserved Runs prevented. Only Statcast’s Fielding Run Value has him significantly higher, where he is a substantially above-average 4.
At the plate? They’re very similar in wOBA, Expected wOBA, and OBP. Contreras gets more walks and home runs, but not a ton more. Romy gets more singles, doubles, triples, and strikes out slightly less. They both chase too much.
Playing in Fenway, Contreras will probably see his doubles numbers catch up to Romy’s, but their home run numbers may get closer too. But Romy is just a slight adjustment away from unlocking a ton more power, as I mentioned above, with his elite hard-hit rate, but tendency to hit the ball into the ground.
Baserunning? Romy is clearly the better one here.
Positional versatility? Slight advantage to Contreras because it’s great to have an emergency backup catcher, but Romy is strong in this category too.
I figured, put Romy at first until Casas is ready, then work things out from there. Get one other infielder, preferably a third baseman, or a Ketel Marte. That would have been best. Anthony, Gonzalez, and Casas could all be giving the Red Sox power in spades if they can all be healthy.
Now instead, Romy plays second base where he’s worse defensively (I hope he gets better), and Casas is kind of blocked. Contreras may be a power hitter, but the Red Sox may not end up with any more power production for his acquisition.
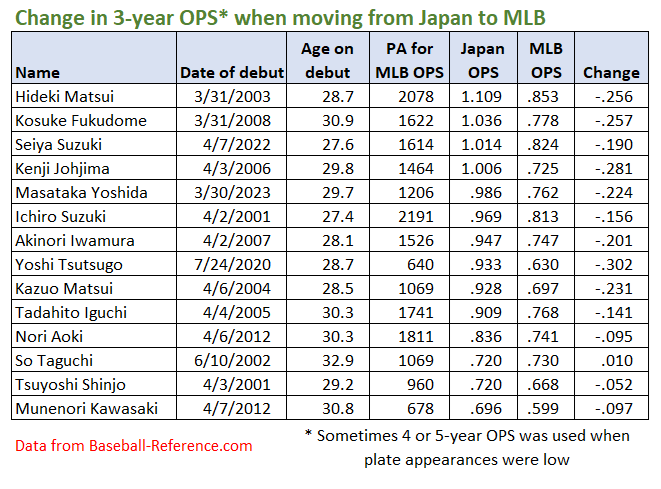
By now, we have a lot of examples to look at to see how a hitter’s results change when leaving the Japanese baseball leagues to join Major League Baseball. So when I saw some fans getting excited about the prospects of their team signing position players Kazuma Okamoto or Munetaka Murakami this offseason, I decided to try to figure out how these two are likely to do in the MLB.
I found a nice page on Wikipedia that listed all the players who made that very switch. Nineteen of them were position players. I then ruled out any players that had less than 600 plate appearances in Major League Baseball, as that small of a sample size doesn’t inspire confidence that we’re getting an accurate measure of their ability in the MLB. That took 4 players out. I also ruled out all players who were too young when they came over for us to expect that their recent past performance would be at the same level as their near future performance. That ruled out just one player – Shohei Ohtani, who was only 23.7 years old when he played his first game in the majors. That’s almost 4 years younger than the next youngest, Ichiro Suzuki, who was 27.4. That left the 14 players you see in the following table:
These 14 players are listed in descending order of their OPS over their last 3 years playing in Japan just before coming to MLB. The three columns on the right are the ones we’re most interested in. It has their 3-year OPS in Japan, their first-3 (or first-4 or first-5) year OPS in MLB, and what the change in OPS was.
As you can see, in all but one case, the OPS comes down. And not just by a little bit – a .200 point drop is typical in this list. If you look closely, you’ll notice that the players who started with a higher OPS in Japan experienced the biggest drops.
Now let’s look at this data visually to see if we can spot any more trends. I’ve plotted each player’s OPS’s on the vertical axis, and their age at the time they started playing in MLB on the horizontal axis.
I can’t say I see an age-related trend here, except that perhaps the youngest have a slightly smaller drop than the older players. What does show is that trend we mentioned above, that the highest drops come from players with the highest OPS’s in Japan. As a rule of thumb, I’d say this:
If the player’s Japan OPS over the previous 3 years was over 1.000, expect a .200 to .275 point drop.
If it was in the .900’s, expect a .150 to .275 point drop.
If it was under .850, expect a .50 to .100 point drop.
This would be a good time to address some of the outlying data points.
Regarding So Taguchi, the only player whose OPS rose (if only by a paltry .010) upon coming to MLB. There are two things about his time in MLB that did not happen for any other player coming from the Japan leagues. The first is the unusual amount of time he spent in the minors his first two years. Going by plate appearances, he spent 96% of his first year in the minors, and 83% of his second year. Every other player to come over spend most or all of their time in the majors. Perhaps they saw some things they could improve with his plate approach? The other thing is how he was used. He was used almost exclusively as a late-innings replacement, and as such, he got a lot of favorable platoon matchups, much more than a full-time player would. This would have boosted his OPS – indeed, it was higher in the majors than in the minors!
Because the way they used Taguchi was so out of the norm, we can’t rely on his data point to inform us about typically-used players who cross over. So we’ll toss that out.
On the other end of things, there is Yoshi Tsutsugo and his .302 point drop, the biggest one in the chart. Is that a good data point? Notice it is based on only 640 major league plate appearances. That’s just above our cutoff amount. Did we pick a cutoff that was too low?
This may be a good time to point out that we may have a bit of survivorship bias happening here. There were four players we omitted from our data because their total plate appearnaces in the majors was below our 600-PA lower limit – in all cases, well below. Three of those four players had OPS drops of more than .300 points. But are those drops so large because the sample sizes are so small? Or were the sample sizes so small because the drops in OPS were so large? We can’t know for sure. And we can’t know if those large drops in OPS would have stayed that large with more plate appearances. All we can say is there might be a survivorship bias occuring here.
And that makes me inclined to keep the Yoshi Tsutsugo data point. It could be our lone representative of all the players whose play was so poor in MLB that they didn’t even play all that much in the end.
Okay, so so far, we’re taking So Taguchi out and that’s it.
Now it’s time to ask, where would Murakami and Okamoto land on this table and chart?
One thing about Murakami: he’ll be more than a year younger than anyone on this chart was on the day of their first MLB game. That could be a relevant difference. So it would be good now to bring back that data point we eliminated before, the player who was even younger when he started, Shohei Ohtani (you may have heard of him).
Here’s the new table with the three of them added:
Here’s the new plot with those three added and So Taguchi removed:
As you can see, I’ve added Murakami and Okamoto, with their OPS’s from their last 3 years in Japan showing, and a guess at where they’ll end up in the majors as a fuzzy orange patch. We can see that Ohtani did have a drop, but the smallest drop of anyone who started over .900 OPS. Was it because he was young, and young players are more likely to be improving with each year? Or was it because he is a unique human being who can master any new challenge he sets his mind to? Probably a little of both. As far as this impacts Murakami, it had me guessing on the smaller side for his OPS drop, but more closely aligned with Ichiro Suzuki’s, who he’s closest to in both starting age and starting OPS.
Okamoto’s drop puts him at a very MLB-average place. I hear he’s got excellent defensive skills: teams interested in him should know that his value will come from his defense, and not from his bat. This is especially important given that he plays positions that tend to be bat-first (corner infield, and outfield).
Murakami, by this analysis, looks to be an above average bat. But how much so? Enough to make up for his unimpressive defense and baserunning? Some have concerns about his ability to hit major league pitching, and his increasing whiff rate. Will teams look at him and see someone who would benefit from better coaching, coaching they may be able to provide? His raw power will still be there, and that may be enough for some to decide he’ll be a help to the team, and to believe they could improve the rest. If they can, he could become quite the acquisition. It’ll be interesting to watch.
Pete Alonso is one of the best bats in baseball, no question about that. But to get his bat at first base, you have to take with it his awful fielding and awful baserunning. That waters down his value to some extent. But by how much? And how does he compare to players currently on the Red Sox, and other available options?
I’ll present the data here and some other observations, so that you can compare. I’ll finish by talking about whether it makes sense for the Red Sox to add a player or stick with who they have. All the data shown here is from BaseballSavant.
The players to be compared
I picked the 3 first base free agents who were considered the best on the market when this offseason began, and put their stats on the top row of the comparisons below. (I started putting these together weeks ago when Josh Naylor was still a free agent.) On the bottom row I put a top first base trade possibility in Yandy Diaz, and the two top major league first base options on the Red Sox currently, Romy Gonzalez and Triston Casas.
For 5 of the players, I show their 2025 numbers. For Triston Casas, who didn’t play enough in 2024 and 2025 to give us a good idea of what he is, I show his 2023 numbers.
Expected stats
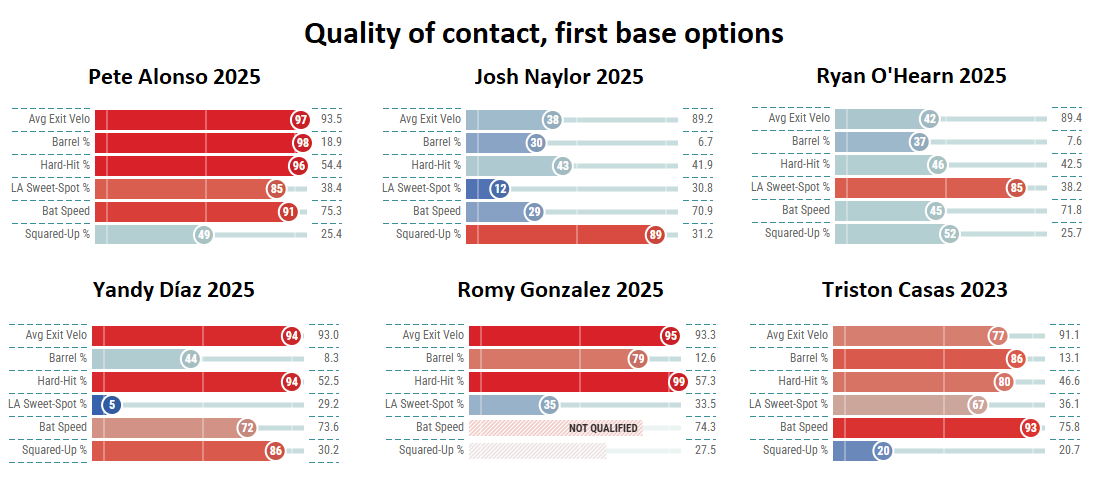
Let’s start with the expected stats. This is where they look at the velocity, launch angle and trajectory of every ball a player put in play, and tally up the probable results based on those numbers.
Focusing primarily on xwOBA, we see that all six players did well, although when you look at the actual values instead of the percentiles, Alonso is clearly separated from the pack, with only Triston Casas giving him a challenge there.
Quality of contact
Now we’ll look at quality of contact.
Alonso had the best overall contact, however Romy Gonzalez had more hard-hit balls. In fact he had the 5th highest Hard Hit% in baseball for players with over 300 PA. (Who was ahead of him? 1. Roman Anthony 2. Kyle Schwarber 3. Shohei Ohtani 4. Aaron Judge.) Yandy Diaz also hit it hard frequently.
But neither Gonzalez nor Diaz get an ideal launch angle (“LA Sweet Spot %”) as much as Alonso does. For both of them it turns out it’s because they hit too many ground balls – Diaz especially. This is likely the reason Diaz’s results aren’t as good as Alonso’s, and for Gonzalez, one of two reasons (we’ll see the other in the next section).
While O’Hearn and Naylor are limited by lower bat speed, O’Hearn improves his results by often having a good launch angle, and Naylor gets a better exit velocity by hitting on the sweet spot of the bat a lot.
Triston Casas’ 2023 comes the closest to Alonso’s 2025 among those pictured here. The differences may only be due to looking at a rookie season versus a veteran in his prime having his best season yet.
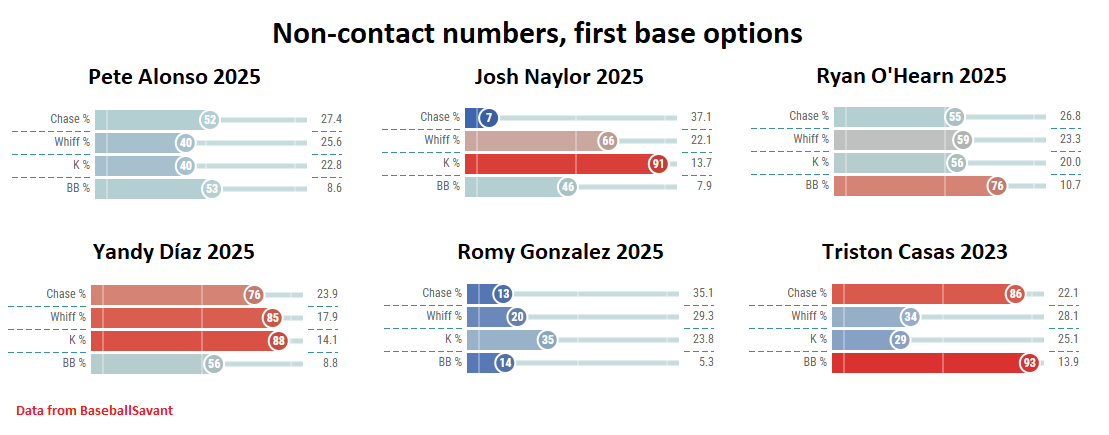
Non-contact stats
So that’s what happens when they swing and make contact. What about the numbers when they don’t make contact? Who chases pitches out of the zone too much (Chase %)? Who misses a lot when he swings (Whiff %)? Who walks too little or strikes out too much?
Alonso and O’Hearn are average in these categories. Yandy Diaz is above average, and Romy Gonzalez is well below average. Triston Casas has a great eye, but still manages to swing and miss at an above average pace. Josh Naylor doesn’t chase and doesn’t strike out, but walks an average amount.
Here we have what looks like the other reason Romy Gonzalez doesn’t get better results despite hitting the ball so hard. He chases too much. And while fixing that doesn’t necessarily fix his higher strikeout rate and low walk rate, it ought to at least help.
Fielding and Baserunning
What’s left? Fielding and baserunning.
Here again we see strong similarity between Triston Casas and Pete Alonso. They’re both terribly slow, and awful at both fielding and baserunning. But being slow isn’t the excuse for the rest, because look at Josh Naylor, who is even slower, but manages to be an average baserunner and a decent fielder.
When it comes to baserunning, Romy Gonzalez is the opposite of Josh Naylor. He’s the only one in this group that could be called “fast”, yet he’s still a poor baserunner. Maybe he should get a pointer or two from his teammate Trevor Story, who runs just as fast as Gonzalez but was one of the top baserunners in the game last year. Or maybe we should give him a little credit for being an average or above average baserunner in the past.
As for good fielders, it looks like Ryan O’Hearn is the only one, with Naylor and Gonzalez a little below average. But Gonzalez split his time between first and second base (and some other spots), and when you break his fielding down by position, both in his career and in 2025, he’s been an above-average fielding first baseman, and a below-average fielder everywhere else.
Categorizing these players
So to sum up, I see two basic types of player here.
Pete Alonso and Triston Casas are the power hitters who can get on base, too, but are awful at fielding and baserunning. Yandy Diaz is, too, but with a little less power and a little better baserunning.
In the other category are Josh Naylor and Ryan O’Hearn, who have some power, but not a lot, but still manage to have above-average impact as hitters. And at everything else, they’re average, on the whole.
The 2025 version of Romy Gonzalez belongs in the O’Hearn/Naylor camp, as a well-rounded player with an above-average bat. But he has the raw tools to become much better. He’s got enough speed to become a great baserunner. He’s one of the best in the game at hitting the ball hard, but he hits it on the ground too much, and he misses it too much. And here’s the thing: the parts of his game that are lacking and that are holding him back, are all things he can learn to be better at. He can learn to be a smarter baserunner. He can learn plate discipline. He can learn to hit the ball just a little lower than he does now, to get it into the air more.
The question is, will he?
If he does, he creates a new category, combining the best of O’Hearn/Naylor with the best of Alonso/Casas, and he’d be better than all of them.
Who’s on first?
So what should the Red Sox do? If they can get Pete Alonso in to play first base for them, should they?
Alonso would certainly help the lineup. But if Triston Casas has a healthy year, he’s basically a Pete Alonso clone for much less money.
What if Casas is injured again, though? He sure seems injury prone. Then your backup plan is Romy Gonzalez, who is as good as your second-or-third best first base free agents that were on the market at the start of this offseason. And with the right coaching and effort, could end up being better than all of them in the short term.
So regardless of whether Casas can or can’t play, the Red Sox will have a plus option at first base. They don’t need Alonso to play first base for them.
But Alonso would improve them at DH. But to make that room, they’d need to trade/drop Masataka Yoshida, to whom they owe $36M over the next two years, and probably one of their 4 top-notch outfielders. Not to say they won’t; they may. But they may not.
In the end, Alonso may not add as much value as people think he will, when compared to what the Red Sox would get from the current players who he would replace. All that may not be worth the expected $150M price tag.