If you look at the playoff odds on FanGraphs.com right now, you’ll see the Texas Rangers listed as having a 0.0% chance of making the playoffs this year. But that doesn’t mean they have no chance. It just means their chance is so small that it doesn’t round up to 0.1%; instead it rounds down to 0.0%, as any chance less than 1 in 2000 will do. As it turns out, their chance of making the playoffs is about 1 in 4000 right now.
How we get to that number involves a lot of logical reasoning, complicated by the fact that the Rangers will play a series against one of the four teams they’re chasing, and there will be two series played this week between some of those same four teams.
Let’s set the stage properly. Here are the 8 remaining playoff contenders in the American League:
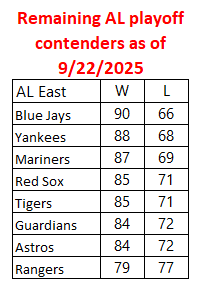
Only 6 teams in the American League may go to the playoffs. To be one of those 6, the Rangers must pass 2 of the 7 teams ahead of them in the standings (so long as one of them is not a division winner). Fortunately for the Rangers, there are 4 teams they still have a chance to reach. Unfortunately, they’ll be very difficult to reach.
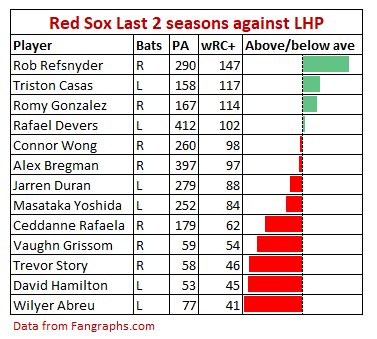
Notice that if the Rangers win all 6 of their remaining games, and the Red Sox lose all 6 of theirs, that the Rangers would only manage to be tied with the Red Sox. But because they hold the tiebreaker over the Red Sox (having won 4 of the 7 games played between them this year), the Rangers would beat out the Red Sox in that case.
The same goes for Detroit. The Tigers must lose all 6 of theirs, and the Rangers must win all 6 of theirs, for the Rangers to tie; because they win the tiebreaker (having won 4 of 6 against the Tigers), the Rangers would beat out the Tigers.
The Rangers did not win their season series against the Astros, however, so must beat them by a game in the final standings, to pass them for a playoff spot. Because they are currently 5 games behind them, that could only happen if the Rangers win all 6 of their remaining games, and the Astros lose all 6 of theirs.
For the Rangers to catch the Guardians, they’ll have to win some of their remaining 3 games against them; those wins would give the tiebreaker to the Rangers. So the Rangers could stand to lose 1 game, or could stand the Guardians winning 1 game, and still beat them for a playoff spot.
Given that there’s only 1 team that isn’t forcing the Rangers to win all their remaining games, but that they need to beat at least 2 of these teams, the only option for the Rangers is to win all their remaining games.
Let’s start a list of requirements like this one:

We’re assuming here that every game a team plays the rest of the way has a 1/2 chance of being a win, and a 1/2 chance of being a loss. Because the Rangers have 6 games remaining, and there’s only 1 way to achieve the stated outcome (Rangers win all 6), that’s 1 outcome out of 26 possible outcomes, or a 1/64 chance of it happening.
What other outcomes must we consider?
Well if none of these teams were playing each other in these final 6 games, it would be a little less complicated. All the outcomes would be independent, so we could calculate the odds of each team’s win totals independently, as a starting point. Our list of requirements would look like this:

Because the Rangers would have to beat at least 2 of these teams, we’d take pairs of outcomes and calculate their odds:
[ (Red Sox lose all) AND (Tigers lose all) ]
OR [ (Red Sox lose all) AND (Astros lose all) ]
OR [ (Red Sox lose all) AND (Guardians lose 5 or 6) ]
OR [ (Tigers lose all) AND (Astros lose all) ]
OR [ (Astros lose all) AND (Guardians lose 5 or 6) ]
Notice that we didn’t include (Tigers lose all) AND (Guardians lose 5 or 6). That’s because one of those teams will win the central division; beating a division winner doesn’t help you win a wild card spot. They have to beat at least one of the Red Sox or Astros to get into the playoffs.
So we would multiply odds everywhere there’s an AND above, and then add them everywhere there is an OR above.
This would double-count or triple-count some cases though. For example, it would triple count the case where all three of these occur: (Red Sox lose all) AND (Tigers lose all) AND (Astros lose all). We’d have to subtract out double the odds of that happening.
After making a few more adjustments where 3 of those occur, we’d probably have one final adjustment to make for the case where all 4 occur:
(Red Sox lose all) AND (Tigers lose all) AND (Astros lose all) AND (Guardians lose 5 or 6).
Then we’d multiply our result by the odds of the Rangers winning all their games, because that has to happen in every case of the Rangers making the playoffs.
But we don’t live in that world. We live in a world where, in the final games of the season:
The Tigers play 3 games against the Red Sox
The Tigers play 3 games against the Guardians
The Rangers play 3 games against the Guardians
Oh my. This reduces the number of games that determine the Rangers’ fate from 30 down to 21. That’s good for the Rangers, because it means a lot fewer games would have to go a certain way for them to make the playoffs, and that gives them better odds.
It also changes how we do this. Now the outcomes we need to consider look like this:

I’ve used highlighting to show outcomes that are related to each other in that they cannot both happen. For example, looking at the two lines in gold, we see that the Red Sox cannot simultaneously lose all their remaining games while also winning all 3 against the Tigers.
Let’s consider those two middle lines right now. If the Tigers lose all their remaining games, that means both the Red Sox and Guardians win at least 3 games. And that means the Rangers can’t beat either of those teams. The only team left that they could beat is the Astros. So if the Rangers beat the Tigers, they must also beat the Astros (and only the Astros) to get into the playoffs. That gives us this:
(Tigers lose all) AND (Astros lose all)
Which is actually this:
(Red Sox win all 3 against the Tigers) AND (Guardians win all 3 against the Tigers) AND (Astros lose all)
And there is no chance of double-counting with other outcomes. This will very much simplify our work to compensate for double countings.
To this we add the following:
[ (Red Sox lose all) AND (Astros lose all) ]
OR [ (Red Sox lose all) AND (Guardians lose 5 or 6) ]
OR [ (Astros lose all) AND (Guardians lose 5 or 6) ]
But consider that in the end we’ll be multiplying everything by the odds of (Rangers win all), which must happen in every scenario. Because the Rangers play 3 of those games against the Guardians, that means three of the Guardian’s losses have already been accounted for by the (Rangers win all) outcome. So we only need to consider the additional chance that the Guardians lose 2 or 3 against the Tigers. So the above becomes:
[ (Red Sox lose all) AND (Astros lose all) ]
OR [ (Red Sox lose all) AND (Guardians lose 2 or 3 to Tigers) ]
OR [ (Astros lose all) AND (Guardians lose 2 or 3 to Tigers) ]
Notice that in all 3 of these scenarios, the Tigers become unreachable to the Rangers, because they win at least 2 games. The only double or triple counting in this trio of scenarios is where the Rangers beat everyone but the Tigers:
(Red Sox lose all) AND (Astros lose all) AND (Guardians lose 2 or 3 to Tigers)
That’s a triple-count, so we have to subtract double the odds of that happening.
We can put all this together, with odds, in a new chart:

We add the first four lines then subtract 2 times the last line to compensate for double counting:
2-12 + 2-12 + 2-7 + 2-7 – 2 x 2-13 = 2-6 + 2-12 = 65/4096.
Which we multiply by the odds of the Rangers winning all 6 of their remaining games, to give 65/262144. That’s about 1 in 4033, or 0.0248%.
Had it not been for teams playing each other, the odds would have been 1 in about 16,186. So the Ranger’s chances of making the playoffs are about 4 times better because of these teams playing against each other.