Sam Antonacci was not a name that I knew before last night. But the Chicago White Sox left fielder definitely got the notice and ire of Red Sox fans when, on the first pitch of the game, he grounded out to first base, and then hit Boston Red Sox first baseman Willson Contreras with an obviously intentional elbow as he ran by. When Contreras asked Antonacci if everything was okay between them, Antonacci just ignored him.
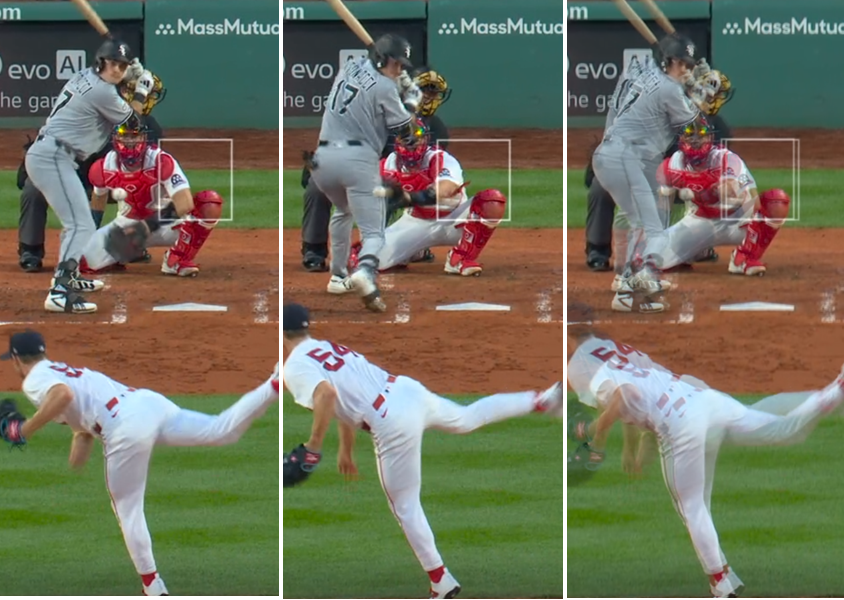
Then in the third inning, when Antonacci was up for the next time, a 93 mph Sonny Gray sinker plunked him on the thigh. Some speculated it was retaliation, but I don’t think the Red Sox would intentionally put him on base in an 0-2 count with a 1-run lead. However, it did look to me like Antonacci may have intentionally moved into the path of the baseball. So I paused the video and was able to see that, had Antonacci just stayed still, he probably wouldn’t have been hit. Certainly not had he done what most hitters do on a low and inside pitch, which is to scooch their feet backward. Instead, Antonacci pivoted on his front foot, so the back of his front leg faced the pitcher’s mound, but also moved closer to the plate. You can see it in these pictures:
In the left frame, the ball is approaching, and Antonacci has not yet begun his attempt to “get out of the way” of the pitch. The second frame is just before the ball strikes him. The third frame is the two images superimposed.
On this superimposed image you can see that his thigh was initially not in the path of the ball, but then moved forward until it was.
On the second frame, notice that even as he is turning away from the ball, he is keeping his eye on the ball. He would do that if he wanted to be precise about where the ball hits him.
So it seemed pretty obvious to me that Antonacci intentionally helped ensure the ball hit him, while disguising it as an attempt to get out of the way of the ball. Kind of the way he intentionally elbowed Contreras while disguising it as accidental contact. Perhaps with the elbow he was trying to set Contreras off, and get him another suspension? That part we can’t know.
But I did feel confident that if Antonacci is the kind of guy who pulls stunts like this, then we might be able to get some extra confirmation of that fact by observing that he has a high hit-by-pitch total. So I looked up the numbers.
Confirmed.
He was actually tied with Willson Contreras for second place on the MLB hit by pitch leaders list at the time of the elbow throw, and for first place in the American League. Perhaps the elbow was out of resentment for not being the outright leader in the stat? Probably not, but it’s fun to speculate surprising if unlikely reasons.
So now he’s in second place by himself, and he got there in relatively few plate appearances. I wonder if he has the highest rate of being hit by pitches? It turns out, for hitters with at least 100 PA, he does:
This can’t just be bad luck.
Could it be because of crowding the plate? Yes. Antonacci does appear to crowd the plate like Contreras does. But he also appears to have a talent for intentionally adding to his HBP totals on the right kind of low and inside pitch.
The Boston Red Sox offense has been up and down this year, but on the whole seems not bad. Their pitching has been very good this year. So has their defense.
So why do they have such a bad record of 31-43 (through the games of Saturday, June 21)?
I’ve noticed there are a lot of games where they come close, but fall just a little short. Sometimes the pitching is there, but the offense isn’t quite enough. Then the offense picks up, but at the same time the pitching falters. Could this be just a case of bad timing? Had they achieved the same game run totals, but just in different games, would the results be about the same, or better, or worse?
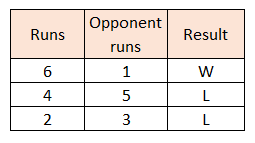
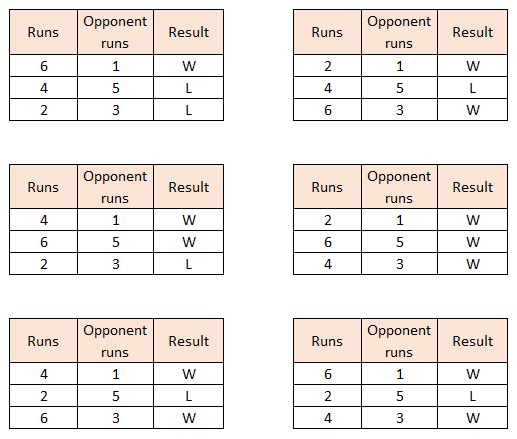
To be sure I’m conveying what I mean correctly, here’s an example. Suppose a team has played 3 games so far in a new baseball season. Their results are as follows:
Their record is 1-2. But it seems they’re playing better than their record – their losses are close, their win is not. They have more runs scored than allowed, overall.
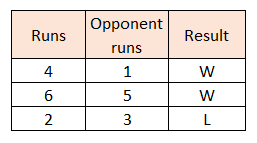
What if the 6-run game had happened when their opponent scored 5 runs? They’d have won that game then. Swapping those first two scores earns them an extra win:
Well that’s interesting. The same performances in a different order gives a different win total. What if we continue this practice? Here are all six orderings that can be done:
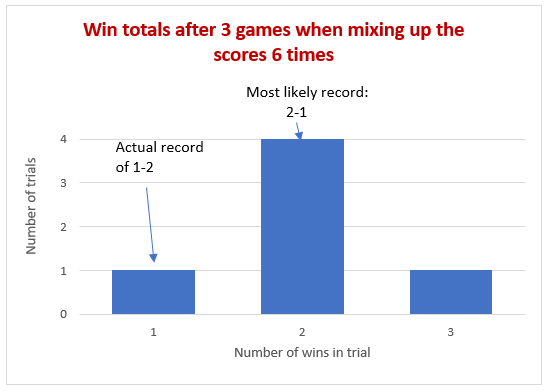
In every alternative ordering, this team gets more wins. In one ordering, they even win all their games! But in most, then have a 2-1 record. Here’s a histogram showing how often each record occurs among the different reorderings:
83% of outcomes are better than their actual record.
Of this team, I would say one of two things. Either they have been unlucky so far, or they have done a poor job at winning close games.
We can do basically this same analysis on the 2026 Boston Red Sox, but because they have 74 games played instead of 3, we can’t calculate the win-loss totals for every possible reordering of their games. The number of different reorderings of 74 games is a huge number, it’s a number with 108 digits. If all the computers on Earth worked together generating those reorderings and evaluating the number of wins for each, and continued working on it for the entire age of the universe, they would barely scratch the surface of the problem.
Fortunately, we can get a good idea of the shape of things by random sampling. While holding the opponents’ scores in their original order, I randomly reordered the Red Sox scores, and counted win totals. And to ensure apples-to-apples comparisons, I did not use end-of-game scores for extra innings games; I always used the score at the end of nine innings. This could still create some imbalance in games where the home team wins after 8 ½ innings or so, but I did not try to compensate for that.
When I got a tie result, I split those results 50/50 – half wins, half losses. This led to some trials producing fractional win totals, such as 33.5. To keep the results to whole numbers of wins and losses, every fractional win total got its count split evenly between the whole number above it, and the whole number below it. For example, there were 42 trials that had a win total of 33.5. So 21 of those trials got counted as 33-win trials, and 21 of them got counted as 34-win trials.
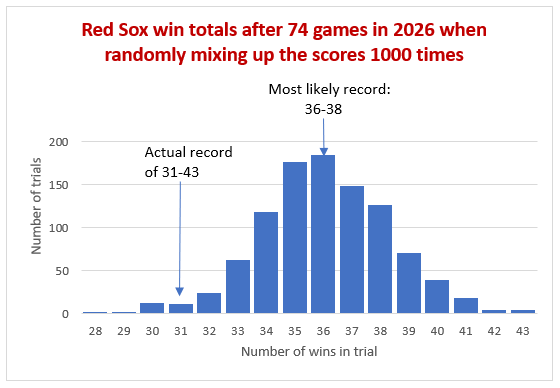
After doing all that, here is a histogram of the results:
Their actual record is down at the lower end of this. Only 2.6% of trials resulted in 31 or fewer wins. That means 97.4% of outcomes were better than their actual record.
18.5% of trials resulted in the most likely win total of 36. This is just one win shy of a .500 record.
Interesting note: there is a formula called “Pythagorean Win-Loss” that predicts what a team’s record ought to be based on its total runs scored and runs allowed. While using less information than the process I described above, it produces the same prediction of a 36-38 record. You can look it up on Baseball-Reference.
But I can draw a few more conclusions. Such as that 59% of outcomes had the Red Sox with a losing record; 15% had them with a .500 record; and 26% had them with a winning record. So there is a greater than 1 in 4 chance that the Red Sox would have a winning record right now, and more than a 2 in 5 chance they would not be a losing team, if their run totals had just happened in a different order this year.
I draw the same conclusion for these 2026 Red Sox as I did for the example above: either they have been unlucky so far, or they have done a poor job at winning close games. My guess is a little of both. That they’re an unlucky team that nonetheless has some fundamental things to work on if they want to be a playoff-caliber team.
Pete Alonso is one of the best bats in baseball, no question about that. But to get his bat at first base, you have to take with it his awful fielding and awful baserunning. That waters down his value to some extent. But by how much? And how does he compare to players currently on the Red Sox, and other available options?
I’ll present the data here and some other observations, so that you can compare. I’ll finish by talking about whether it makes sense for the Red Sox to add a player or stick with who they have. All the data shown here is from BaseballSavant.
The players to be compared
I picked the 3 first base free agents who were considered the best on the market when this offseason began, and put their stats on the top row of the comparisons below. (I started putting these together weeks ago when Josh Naylor was still a free agent.) On the bottom row I put a top first base trade possibility in Yandy Diaz, and the two top major league first base options on the Red Sox currently, Romy Gonzalez and Triston Casas.
For 5 of the players, I show their 2025 numbers. For Triston Casas, who didn’t play enough in 2024 and 2025 to give us a good idea of what he is, I show his 2023 numbers.
Expected stats
Let’s start with the expected stats. This is where they look at the velocity, launch angle and trajectory of every ball a player put in play, and tally up the probable results based on those numbers.
Focusing primarily on xwOBA, we see that all six players did well, although when you look at the actual values instead of the percentiles, Alonso is clearly separated from the pack, with only Triston Casas giving him a challenge there.
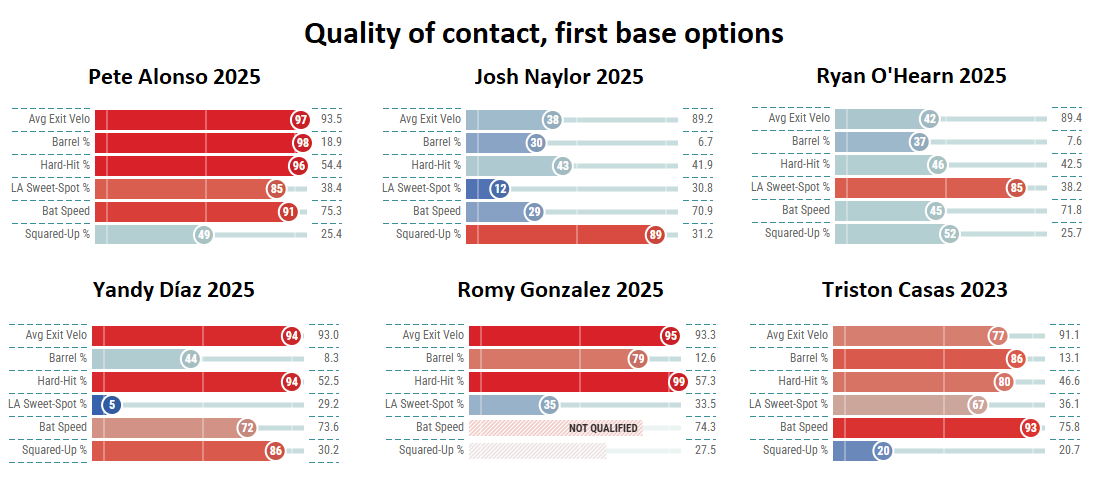
Quality of contact
Now we’ll look at quality of contact.
Alonso had the best overall contact, however Romy Gonzalez had more hard-hit balls. In fact he had the 5th highest Hard Hit% in baseball for players with over 300 PA. (Who was ahead of him? 1. Roman Anthony 2. Kyle Schwarber 3. Shohei Ohtani 4. Aaron Judge.) Yandy Diaz also hit it hard frequently.
But neither Gonzalez nor Diaz get an ideal launch angle (“LA Sweet Spot %”) as much as Alonso does. For both of them it turns out it’s because they hit too many ground balls – Diaz especially. This is likely the reason Diaz’s results aren’t as good as Alonso’s, and for Gonzalez, one of two reasons (we’ll see the other in the next section).
While O’Hearn and Naylor are limited by lower bat speed, O’Hearn improves his results by often having a good launch angle, and Naylor gets a better exit velocity by hitting on the sweet spot of the bat a lot.
Triston Casas’ 2023 comes the closest to Alonso’s 2025 among those pictured here. The differences may only be due to looking at a rookie season versus a veteran in his prime having his best season yet.
Non-contact stats
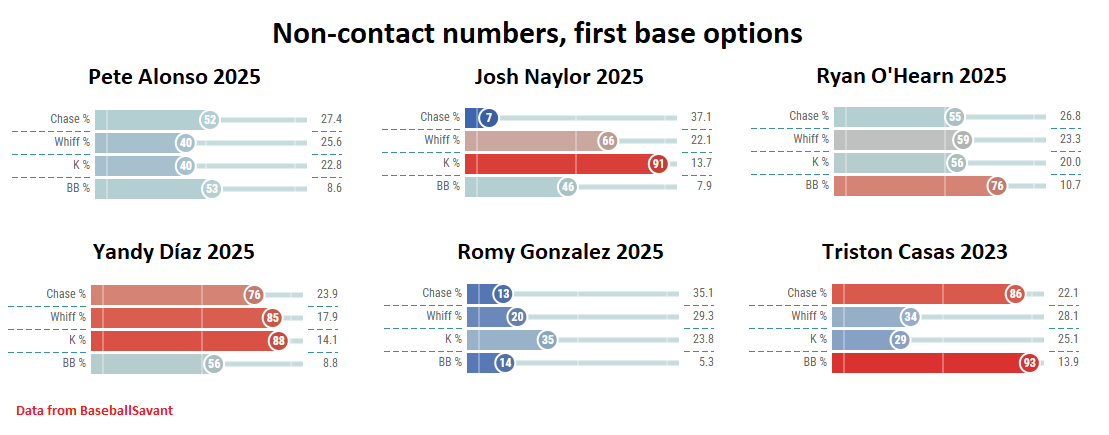
So that’s what happens when they swing and make contact. What about the numbers when they don’t make contact? Who chases pitches out of the zone too much (Chase %)? Who misses a lot when he swings (Whiff %)? Who walks too little or strikes out too much?
Alonso and O’Hearn are average in these categories. Yandy Diaz is above average, and Romy Gonzalez is well below average. Triston Casas has a great eye, but still manages to swing and miss at an above average pace. Josh Naylor doesn’t chase and doesn’t strike out, but walks an average amount.
Here we have what looks like the other reason Romy Gonzalez doesn’t get better results despite hitting the ball so hard. He chases too much. And while fixing that doesn’t necessarily fix his higher strikeout rate and low walk rate, it ought to at least help.
Fielding and Baserunning
What’s left? Fielding and baserunning.
Here again we see strong similarity between Triston Casas and Pete Alonso. They’re both terribly slow, and awful at both fielding and baserunning. But being slow isn’t the excuse for the rest, because look at Josh Naylor, who is even slower, but manages to be an average baserunner and a decent fielder.
When it comes to baserunning, Romy Gonzalez is the opposite of Josh Naylor. He’s the only one in this group that could be called “fast”, yet he’s still a poor baserunner. Maybe he should get a pointer or two from his teammate Trevor Story, who runs just as fast as Gonzalez but was one of the top baserunners in the game last year. Or maybe we should give him a little credit for being an average or above average baserunner in the past.
As for good fielders, it looks like Ryan O’Hearn is the only one, with Naylor and Gonzalez a little below average. But Gonzalez split his time between first and second base (and some other spots), and when you break his fielding down by position, both in his career and in 2025, he’s been an above-average fielding first baseman, and a below-average fielder everywhere else.
Categorizing these players
So to sum up, I see two basic types of player here.
Pete Alonso and Triston Casas are the power hitters who can get on base, too, but are awful at fielding and baserunning. Yandy Diaz is, too, but with a little less power and a little better baserunning.
In the other category are Josh Naylor and Ryan O’Hearn, who have some power, but not a lot, but still manage to have above-average impact as hitters. And at everything else, they’re average, on the whole.
The 2025 version of Romy Gonzalez belongs in the O’Hearn/Naylor camp, as a well-rounded player with an above-average bat. But he has the raw tools to become much better. He’s got enough speed to become a great baserunner. He’s one of the best in the game at hitting the ball hard, but he hits it on the ground too much, and he misses it too much. And here’s the thing: the parts of his game that are lacking and that are holding him back, are all things he can learn to be better at. He can learn to be a smarter baserunner. He can learn plate discipline. He can learn to hit the ball just a little lower than he does now, to get it into the air more.
The question is, will he?
If he does, he creates a new category, combining the best of O’Hearn/Naylor with the best of Alonso/Casas, and he’d be better than all of them.
Who’s on first?
So what should the Red Sox do? If they can get Pete Alonso in to play first base for them, should they?
Alonso would certainly help the lineup. But if Triston Casas has a healthy year, he’s basically a Pete Alonso clone for much less money.
What if Casas is injured again, though? He sure seems injury prone. Then your backup plan is Romy Gonzalez, who is as good as your second-or-third best first base free agents that were on the market at the start of this offseason. And with the right coaching and effort, could end up being better than all of them in the short term.
So regardless of whether Casas can or can’t play, the Red Sox will have a plus option at first base. They don’t need Alonso to play first base for them.
But Alonso would improve them at DH. But to make that room, they’d need to trade/drop Masataka Yoshida, to whom they owe $36M over the next two years, and probably one of their 4 top-notch outfielders. Not to say they won’t; they may. But they may not.
In the end, Alonso may not add as much value as people think he will, when compared to what the Red Sox would get from the current players who he would replace. All that may not be worth the expected $150M price tag.
If you look at the playoff odds on FanGraphs.com right now, you’ll see the Texas Rangers listed as having a 0.0% chance of making the playoffs this year. But that doesn’t mean they have no chance. It just means their chance is so small that it doesn’t round up to 0.1%; instead it rounds down to 0.0%, as any chance less than 1 in 2000 will do. As it turns out, their chance of making the playoffs is about 1 in 4000 right now.
How we get to that number involves a lot of logical reasoning, complicated by the fact that the Rangers will play a series against one of the four teams they’re chasing, and there will be two series played this week between some of those same four teams.
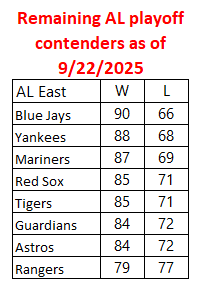
Let’s set the stage properly. Here are the 8 remaining playoff contenders in the American League:
Only 6 teams in the American League may go to the playoffs. To be one of those 6, the Rangers must pass 2 of the 7 teams ahead of them in the standings (so long as one of them is not a division winner). Fortunately for the Rangers, there are 4 teams they still have a chance to reach. Unfortunately, they’ll be very difficult to reach.
Notice that if the Rangers win all 6 of their remaining games, and the Red Sox lose all 6 of theirs, that the Rangers would only manage to be tied with the Red Sox. But because they hold the tiebreaker over the Red Sox (having won 4 of the 7 games played between them this year), the Rangers would beat out the Red Sox in that case.
The same goes for Detroit. The Tigers must lose all 6 of theirs, and the Rangers must win all 6 of theirs, for the Rangers to tie; because they win the tiebreaker (having won 4 of 6 against the Tigers), the Rangers would beat out the Tigers.
The Rangers did not win their season series against the Astros, however, so must beat them by a game in the final standings, to pass them for a playoff spot. Because they are currently 5 games behind them, that could only happen if the Rangers win all 6 of their remaining games, and the Astros lose all 6 of theirs.
For the Rangers to catch the Guardians, they’ll have to win some of their remaining 3 games against them; those wins would give the tiebreaker to the Rangers. So the Rangers could stand to lose 1 game, or could stand the Guardians winning 1 game, and still beat them for a playoff spot.
Given that there’s only 1 team that isn’t forcing the Rangers to win all their remaining games, but that they need to beat at least 2 of these teams, the only option for the Rangers is to win all their remaining games.
Let’s start a list of requirements like this one:
We’re assuming here that every game a team plays the rest of the way has a 1/2 chance of being a win, and a 1/2 chance of being a loss. Because the Rangers have 6 games remaining, and there’s only 1 way to achieve the stated outcome (Rangers win all 6), that’s 1 outcome out of 26 possible outcomes, or a 1/64 chance of it happening.
What other outcomes must we consider?
Well if none of these teams were playing each other in these final 6 games, it would be a little less complicated. All the outcomes would be independent, so we could calculate the odds of each team’s win totals independently, as a starting point. Our list of requirements would look like this:
Because the Rangers would have to beat at least 2 of these teams, we’d take pairs of outcomes and calculate their odds:
[ (Red Sox lose all) AND (Tigers lose all) ] OR [ (Red Sox lose all) AND (Astros lose all) ] OR [ (Red Sox lose all) AND (Guardians lose 5 or 6) ] OR [ (Tigers lose all) AND (Astros lose all) ] OR [ (Astros lose all) AND (Guardians lose 5 or 6) ]
Notice that we didn’t include (Tigers lose all) AND (Guardians lose 5 or 6). That’s because one of those teams will win the central division; beating a division winner doesn’t help you win a wild card spot. They have to beat at least one of the Red Sox or Astros to get into the playoffs.
So we would multiply odds everywhere there’s an AND above, and then add them everywhere there is an OR above.
This would double-count or triple-count some cases though. For example, it would triple count the case where all three of these occur: (Red Sox lose all) AND (Tigers lose all) AND (Astros lose all). We’d have to subtract out double the odds of that happening.
After making a few more adjustments where 3 of those occur, we’d probably have one final adjustment to make for the case where all 4 occur:
(Red Sox lose all) AND (Tigers lose all) AND (Astros lose all) AND (Guardians lose 5 or 6).
Then we’d multiply our result by the odds of the Rangers winning all their games, because that has to happen in every case of the Rangers making the playoffs.
But we don’t live in that world. We live in a world where, in the final games of the season:
The Tigers play 3 games against the Red Sox The Tigers play 3 games against the Guardians The Rangers play 3 games against the Guardians
Oh my. This reduces the number of games that determine the Rangers’ fate from 30 down to 21. That’s good for the Rangers, because it means a lot fewer games would have to go a certain way for them to make the playoffs, and that gives them better odds.
It also changes how we do this. Now the outcomes we need to consider look like this:
I’ve used highlighting to show outcomes that are related to each other in that they cannot both happen. For example, looking at the two lines in gold, we see that the Red Sox cannot simultaneously lose all their remaining games while also winning all 3 against the Tigers.
Let’s consider those two middle lines right now. If the Tigers lose all their remaining games, that means both the Red Sox and Guardians win at least 3 games. And that means the Rangers can’t beat either of those teams. The only team left that they could beat is the Astros. So if the Rangers beat the Tigers, they must also beat the Astros (and only the Astros) to get into the playoffs. That gives us this:
(Tigers lose all) AND (Astros lose all)
Which is actually this:
(Red Sox win all 3 against the Tigers) AND (Guardians win all 3 against the Tigers) AND (Astros lose all)
And there is no chance of double-counting with other outcomes. This will very much simplify our work to compensate for double countings.
To this we add the following:
[ (Red Sox lose all) AND (Astros lose all) ] OR [ (Red Sox lose all) AND (Guardians lose 5 or 6) ] OR [ (Astros lose all) AND (Guardians lose 5 or 6) ]
But consider that in the end we’ll be multiplying everything by the odds of (Rangers win all), which must happen in every scenario. Because the Rangers play 3 of those games against the Guardians, that means three of the Guardian’s losses have already been accounted for by the (Rangers win all) outcome. So we only need to consider the additional chance that the Guardians lose 2 or 3 against the Tigers. So the above becomes:
[ (Red Sox lose all) AND (Astros lose all) ] OR [ (Red Sox lose all) AND (Guardians lose 2 or 3 to Tigers) ] OR [ (Astros lose all) AND (Guardians lose 2 or 3 to Tigers) ]
Notice that in all 3 of these scenarios, the Tigers become unreachable to the Rangers, because they win at least 2 games. The only double or triple counting in this trio of scenarios is where the Rangers beat everyone but the Tigers:
(Red Sox lose all) AND (Astros lose all) AND (Guardians lose 2 or 3 to Tigers)
That’s a triple-count, so we have to subtract double the odds of that happening.
We can put all this together, with odds, in a new chart:
We add the first four lines then subtract 2 times the last line to compensate for double counting:
Which we multiply by the odds of the Rangers winning all 6 of their remaining games, to give 65/262144. That’s about 1 in 4033, or 0.0248%.
Had it not been for teams playing each other, the odds would have been 1 in about 16,186. So the Ranger’s chances of making the playoffs are about 4 times better because of these teams playing against each other.
There is a very very narrow range of circumstances under which the Toronto Blue Jays do not make the playoffs. So narrow, in fact, that if we assume every game remaining in the MLB this year has a 50% chance of being won by either team, the odds of the Blue Jays failing to make the playoffs are 1 about 793,072. That equates to a 99.999874% chance that they make the playoffs.
So how do we work out such numbers? Buckle up for a logic roller coaster ride.
To fail to get into the playoffs, every one of the Yankees, Red Sox, Mariners, Astros, Tigers, and Gaurdians would have to beat the Blue Jays, and these are the only 6 teams capable of surpassing the Blue Jays at this point.
At this point, the Blue Jays can end up with at most 73 losses, if they lose all 7 of their remaining games. So surpassing them would especially require a lot of winning by the Gaurdians and Astros (with 71 losses each currently) and the Red Sox and Tigers (with 70 losses each).
But these teams are limited in how much winning they can do the rest of the way, because there will be 6 games played between them. The Tigers and the Gaurdians will play 3 games against each other, and the Tigers and the Red Sox will play 3 against each other. That means there will be at least 6 losses spread around among those 3 teams.
So let’s consider the possible outcomes of the Tigers/Gaurdians series. For each outcome, let’s assume the Blue Jays lose all 7 of their remaining games, ending with a record of 89-73. Let’s also assume both the Tigers and the Gaurdians win all 4 of their other remaining games.
Except that we can’t assume that. Because if the Tigers win all their other 4 games, that means they deliver 3 losses to the Red Sox, who end up at best 89-73, the same as the Blue Jays. Because the Blue Jays end up with 7 wins and 6 losses against the Red Sox, they win the tiebreaker with the Red Sox and are in the playoffs. So the Tigers must lose a game to the Red Sox, and the Red Sox must win their other 4 games not against the Tigers, for the Blue Jays to have a chance at elimination here.
So we’ll assume the Tigers lose 1 more game (versus the Red Sox) outside of the Tigers/Gaurdians series, and the Guardians don’ t lose any others.
If the Gaurdians sweep the Tigers, the Tigers end up 88-74, a game behind the Blue Jays, and the Blue Jays are in the playoffs.
If the Tigers sweep the Guardians, the Gaurdians end up 88-74, a game behind the Blue Jays, and the Blue Jays are in the playoffs.
If the Gaurdians win 2 of 3, the Tigers end up 89-73, tied with the Blue Jays. Because the Blue Jays had 4 wins and 3 losses in their games against the Tigers this year, they win the tiebreaker between the teams, and are in the playoffs.
That leaves the scenario where the Tigers win 2 of 3. Then the Tigers end up 90-72, ahead of the Blue Jays, while the Guardians tie the Blue Jays at 89-73. So as a tiebreaker we look and see that the Blue Jays and Gaurdians each won 3 games against each other this year. We have to use the second tiebreaker, which is records within their own divisions. The Gaurdians end up 36 and 16 against their weaker division; the Blue Jays 25 and 27 against their stronger division. The Gaurdians therefore win this tiebreaker, and the Blue Jays are out of the playoffs – if the other 3 teams surpass them too, that is.
That’s the only scenario in which the Blue Jays are eliminated.
What if The Tigers lose one more game against another opponent? Then they end up with the same record as the Blue Jays, and the Blue Jays are in because they win the tiebreaker with the Tigers. So the Tigers must only lose the one game against the Red Sox.
That covers what must happen with the Tigers, Gaurdians, and Red Sox. What of the Yankees, Mariners, and Astros?
The Blue Jays hold the tiebreaker over the Yankees, so the Yankees must get to at least 90 wins, and therefore must win at least 3 of their last 7 games.
The Blue Jays hold the tiebreaker over the Mariners, so the Mariners must win at least 4 of their last 7 games.
The Astros hold the tiebreaker over the Blue Jays, so they must win at least 5 of their last 7 games.
So now we must get the odds of all these things happening and multiply them together to get the odds that the Blue Jays miss the playoffs. We assume in every game that the teams have an equal chance of winning. The following table contains all the odds:
The reason the Mariners and Astros are lumped together in the last line is that they play one more game against each other, so their odds of reaching their respective win totals are linked because of that game.
When you multiply all these odds together you get 693,198 divided by 2 to the 39th power, which is about 1 in 793,072, or 0.000126%. That’s the odds that they don’t make the playoffs; so the odds that they make the playoffs are about 99.999874%.
The merit method of awarding wins fixes all the injustices that the current method of awarding wins punishes starting pitchers with. The latest of these injustices happened to Garrett Crochet, ace of the Boston Red Sox, last night. He threw 8 scoreless, 3-hit innings before giving up a game-tying solo home run to baseball’s best hitter, Aaron Judge, with one out in the top of the ninth. With only one run of support from his teammates, that tie score made Crochet ineligible to earn a win, as he was removed from the game at that point, and the current rules say the win goes to the pitcher who was the active pitcher when the winning team took its final lead. So the win went to Garrett Whitlock, who retired the two batters he faced in the top of the 10th inning. Whitlock performed well. But who did more to earn the win? The guy who faced 2 batters over 1 inning of work, giving up no runs, or the guy who faced 30 batters over 8 and 1/3 innings, giving up 1 run to a top offense and the Red Sox’ arch rivals?
Using that method, we take the 2 runs that the Red Sox scored in Friday’s game and divide by 9 and 2/3, which is the number of innings the Red Sox were at bat. This gives us the average number of runs the Red Sox scored in each inning, the fraction 6/29. Then we simply credit each Red Sox pitcher with this number of runs for every inning they pitched. And then we subtract from this the number of runs they gave up. This gives each pitcher a number of “Runs Ahead”. Then we give the win to the pitcher with the greatest number of Runs Ahead.
The cool thing about this method is that adding the Runs Ahead of all the winning team’s pitchers always gives you a positive number, and adding all the Runs Ahead of the losing team’s pitchers always gives you a negative number. This method also assigns the losing pitcher as the one with the most negative Runs Ahead value.
Here’s a table showing the numbers discussed above for the Red Sox pitchers in last night’s game. In the first three columns in the table below we see IP, RCr/IP, and RCr, which stand for Innings Pitched, Runs Credited per inning pitched, and Runs Credited, respectively. You get the third column (Runs Credited) by multiplying together the first two.
Pitcher
IP
RCr/IP
RCr
R
RA
Garrett Crochet
8 ⅓
6/29
50/29
1
21/29
Aroldis Chapman
⅔
6/29
4/29
0
4/29
Garrett Whitlock
1
6/29
6/29
0
6/29
Runs Ahead (RA) calculations for Red Sox pitchers in victory over New York Yankees, June 13, 2025
Then you subtract runs allowed (R) from this to get each pitcher’s number of Runs Ahead (RA) for that game. Because Garrett Crochet had the highest number of Runs Ahead for the winning team, he would be awarded the win by the merit method. But by current rules, the win went to the other Garrett (Whitlock).
I hope someday to convince MLB league officials to change to the merit method for awarding wins. It fixes so many things that are just not right about the current method.
Of course, one could say that the “most .500” Major League Baseball team in any given year is the one whose record is closest to .500, or 81-81 in a full season. But even a hypothetical team that always had exactly a 50% chance of winning would sometimes end up, by luck of the “coin flip”, a few games away from .500.
And what about a team that’s great for the first half of the season, then awful for the second half, ending up with a .500 record? They weren’t really a .500 team at any point in the season, in that their chance of winning games wasn’t actually close to 50% at any point, nor were they winning about half their games in any given week.
So here are a few different ways to measure how .500 a team was, along with the top teams by each method.
Final Record
We can just look at a team’s final record and see how many games away from .500 it was, above or below.
The Boston Red Sox had the only .500 record, but several other teams were close.
The run differential of a team is the runs it scores over the entire season minus the runs it allowed in that same time. A small run differential is a good predictor of a team that will have a record near .500. (There is even a stat called Pythagorean expectation which estimates what record a team should have based on it totals of runs scored and runs allowed.)
Whose run differential was closest to 0 in 2024?
Four teams had a run differential close to 0. Of these, again, the Boston Red Sox were the closest to 0, just barely. It seems we have a frontrunner.
Number of times at .500
A team that plays “a .500 brand of baseball” throughout the season is likely to have a winning percentage of exactly .500 at several times during the course of the season. The most times this could possibly happen is 81, though even for a hypothetical team that always has a 50% chance of winning, the odds of that happening 81 times are over 2,000,000,000,000,000,000,000,000 to 1 against. The most times it’s ever been done, at least before 2020, is 35 by the 1959 Chicago Cubs.
The Tampa Bay Rays came close to that this year, tying for 3rd most. The Padres, Red Sox, and Cardinals also had a lot.
For fun: consecutive times at .500
This last one is more about the luck of streaks than anything else. But there was an interesting streak this year in this regard, so I thought I’d throw it in.
When a team is at .500 in the middle of the season, the next game they play takes them off of .500; it’s only 2 games later that they can be back at .500 again. So a streak of consecutive times at .500 means that at the end of every 2 games played after being at .500, they’re back at .500 again.
The Red Sox were at 26-26 on May 25, 2024 – 26 wins and 26 losses. Two games after that they were 27-27, then 28-28, 29-29, and so on up to 35-35. That’s ten times in a row at .500. The likelihood of that happening, once a team has reached a .500 record, is more than 500-to-1 against.
Here are the longest such streaks in the majors in 2024:
The “Winner”
It’s gotta be the Boston Red Sox as The Most .500 Team of 2024. They top every list except number of times at .500, and they did pretty well there, too. Runner up goes to the Tampa Bay Rays.
Interestingly, these two teams played each other in their last 3 games of the season, with the Rays winning the first two but losing the final game. Had they won it, they would have replaced the Red Sox atop the Final Record list, probably solidified the Red Sox hold on the Run Differential list, but strengthened their own position atop the Times At .500 list. That game was something of a battle for Most .500 Team of 2024. Congratulations, Red Sox, on your “victory”!
Back on Wednesday morning, I showed that Xander Bogaerts and Miguel Cabrera were hitting at paces that would cause Bogaerts to (most likely) surpass Cabrera for the AL batting title. Though I didn’t mention it at the time, these projections also showed that he’d reach 200 hits even if he sat out a couple of games, and a few more than that if he played all the remaining games. After a pair of low-hit games knocked Bogaerts off that pace, his 3-for-4 performance last night has put him right back on it.
In trying to project future totals using “the pace at which a player is producing right now”, how many games do you use to determine what that pace is? The last 5? The last 10? 20?
I circumvent that question by using all of them … I calculate his pace of production over his last 5, 6, 7, 8, etc. games, then use that pace applied over the remaining number of games to be played to see what final numbers he’s headed for. This gives a big collection of possible final numbers; you then choose one in the middle.
On Wednesday I did that for Cabrera and Bogaerts using their paces of production as established by their last 8, 9, 10, etc. up to their last 20 games. That gave 13 paces of production for each player. I then applied these to their remaining games assuming they’d not sit out any games, and then again assuming they’d each sit out two games. I got these results:
If playing all remaining games
Bogaerts
Cabrera
Low
0.327
0.324
Median
0.329
0.326
High
0.332
0.331
If sitting out two games
Bogaerts
Cabrera
Low
0.327
0.326
Median
0.329
0.328
High
0.331
0.332
In all but one of these 26 projections, Bogaerts would end up with at least 200 hits.
I just updated these numbers, and now they look like this:
If playing all remaining games
Bogaerts
Cabrera
Low
0.327
0.325
Median
0.329
0.326
High
0.330
0.332
If sitting out two games
Bogaerts
Cabrera
Low
0.327
0.327
Median
0.328
0.328
High
0.329
0.332
Here are Bogaerts’ projected numbers of hits:
Bogaerts projected 2015 hits
# of recent games used
If playing all games
If sitting two games
20
204.0
200.8
19
203.3
200.2
18
203.0
200.0
17
203.3
200.2
16
203.6
200.5
15
204.0
200.8
14
205.1
201.7
13
204.9
201.5
12
203.8
200.7
11
204.4
201.1
10
204.0
200.8
9
204.7
201.3
8
204.3
201.0
Longer term projections (based on his last 40 or more games) almost all have him finishing with 200 hits exactly if he sits out 2 games, 203 hits if he plays all remaining games, and a .327 average.
If they play it out, and stay on pace, Bogaerts probably will win the batting title and will get to 200 hits.
So far of the 3 predictions I’ve made this October that have been tested, 2 ended up being correct:
Rays beat Rangers on the strength of David Price’s performance: correct.
Pirates beat Reds because it’s just the right ending: correct (the Pirates fans pretty much willed them to win).
Indians defeat Rays: incorrect.
So, not bad so far. I am emboldened to make some division series predictions now!
I’ve already called the Red Sox and A’s as winners. Let’s add the Pirates and the Dodgers to the mix. But let’s also get a little more specific.
Red Sox’s “rust” from not having played live baseball since Sunday could cost them game 1 against the Rays, despite their efforts to create some game-like intensity for Wednesday’s scrimmage, including letting fans come watch, a move I have publicly encouraged. We’ve seen the effects of this many times before; perhaps none so clear as in the 2004 ALCS (also notable in my memory is the 2007 World Series). So I won’t call game 1 either way, despite the Red Sox having home field and having their pitching lined up the way they like. I’ll just say that neither team scores more than 5 runs in the first 9. I will predict that the Red Sox will take every game starting with Game 2.
Rust won’t be a factor for A’s and Tigers who’ve had equal amounts of rest. It’ll be a good matchup, so A’s in 5 games. I won’t call specific games except as implied by the series going 5 games … so basically games 1-3 will be split, game 4 will be taken by whoever trails in the series, and game 5 will be taken by the A’s.
The Pirates will have a better chance against St. Louis than some may think, and I don’t think they can lose at home in this series with the best “10th Man” going in their very enthusiastic fans. I think they can take 1 of 3 in St. Louis, so it’s just a question of which one. I’ll play the rust card here again (hmm, but “rust” and “cardinal” are shades of red … interesting) and say Cardinals take game 2, and Pirates take games 1, 3, and 4.
The Dodgers and Braves: the Dodgers’ injuries make them vulnerable, but their 1-2 punch of Kershaw and Greinke makes them favorites. Starting pitching is huge in the playoffs, and these two ought to be able to handle the Braves’ lineup. In this series, the road team may be the victor each time. I’ll go with that bold prediction: the road team wins each game. Dodgers in 5.
So, if I count correctly, that’s 14 or 15 distinct predictions, depending on whether the Rays win game 1 against the Red Sox (15) or the Red Sox win (14). We shall see how it goes!