
In April 2015, I set out to find the functional relationship between on base percentage (OBP) and run production for baseball teams. I did this to help answer some questions I was pondering about how much synergy results from raising a team’s on-base percentage (OBP) ever higher. By making some rather radical simplifying assumptions, I ended up discovering a pretty tidy set of formulas in terms of p, the probability that a batter reaches base in any plate appearance, and L, the number of batters that reach base in the inning before runs start scoring (or alternatively the number of runners left on base at the end of an inning). These are:
![Expected\ runs\ per\ inning\ =\ \dfrac{p^{L+1}}{1-p} [3 + 2L(1-p) + \frac{1}{2}L(L+1)(1-p)^2]](https://s0.wp.com/latex.php?latex=Expected%5C+runs%5C+per%5C+inning%5C+%3D%5C+%5Cdfrac%7Bp%5E%7BL%2B1%7D%7D%7B1-p%7D+%C2%A0%5B3+%2B+2L%281-p%29+%2B+%5Cfrac%7B1%7D%7B2%7DL%28L%2B1%29%281-p%29%5E2%5D&bg=ffffff&fg=333A42&s=0&c=20201002)
If we approximate p with a team’s collective on-base percentage (OBP), this formula provides a relationship between OBP and run production.
It may look a bit complicated, but it can be broken up into three more digestible and quite meaningful parts.
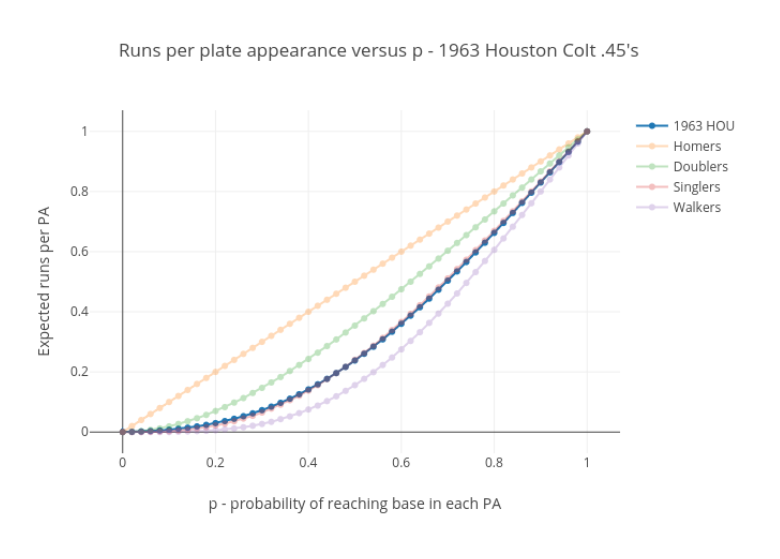
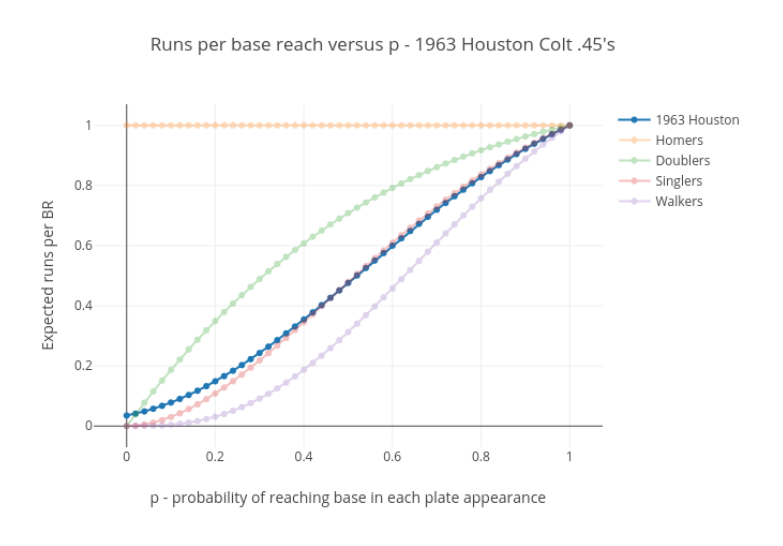
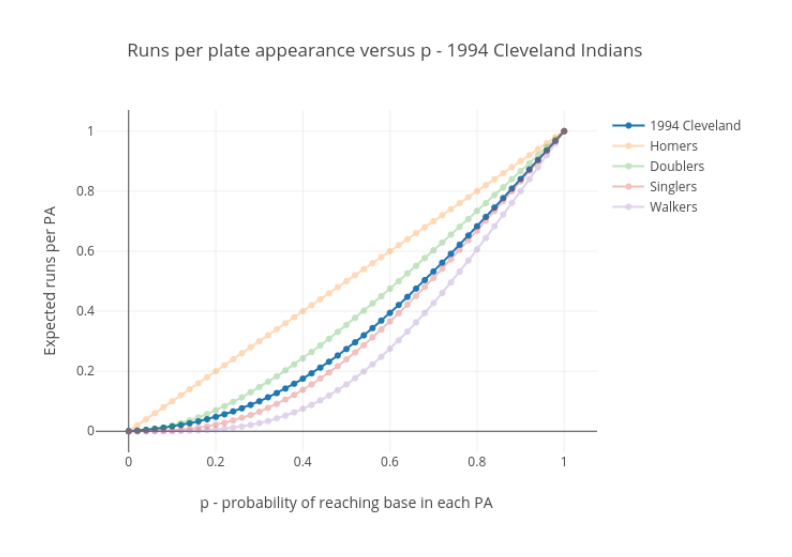
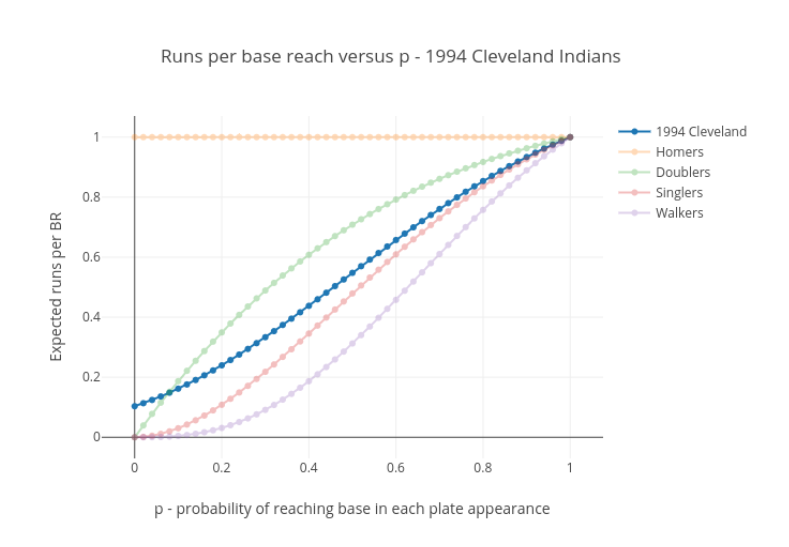
Two other ways of measuring run production that I have found useful to consider are runs per plate appearance, and runs per base reach. We can convert the runs per inning formula above to runs per plate appearance by multiplying by the quantity (1-p) and dividing by 3. We can further convert this to runs per base reach by dividing by p. This gives us the two additional formulas
![Expected\ runs\ per\ plate\ appearance = \dfrac{p^{L+1}}{3} [3 + 2L(1-p) + \frac{1}{2}L(L+1)(1-p)^2]](https://s0.wp.com/latex.php?latex=Expected%5C+runs%5C+per%5C+plate%5C+appearance+%3D+%5Cdfrac%7Bp%5E%7BL%2B1%7D%7D%7B3%7D+%C2%A0%5B3+%2B+2L%281-p%29+%2B+%5Cfrac%7B1%7D%7B2%7DL%28L%2B1%29%281-p%29%5E2%5D&bg=ffffff&fg=333A42&s=0&c=20201002)
![Expected\ runs\ per\ base\ reach\ =\ \dfrac{p^L}{3} [3 + 2L(1-p) + \frac{1}{2}L(L+1)(1-p)^2]](https://s0.wp.com/latex.php?latex=Expected%5C+runs%5C+per%5C+base%5C+reach%5C+%3D%5C+%5Cdfrac%7Bp%5EL%7D%7B3%7D+%C2%A0%5B3+%2B+2L%281-p%29+%2B+%5Cfrac%7B1%7D%7B2%7DL%28L%2B1%29%281-p%29%5E2%5D&bg=ffffff&fg=333A42&s=0&c=20201002)
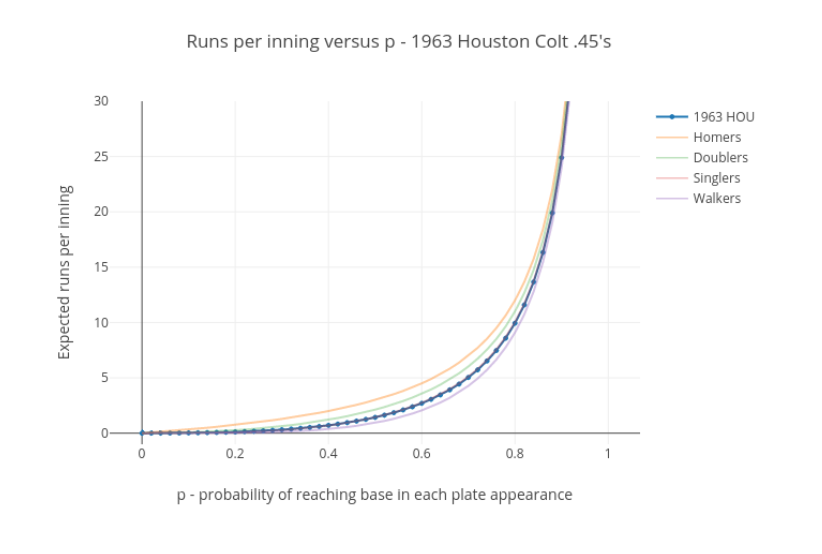
Here are plots of each of these run production measures versus p for each of the L = 0, 1, 2, and 3 components (please see Interpreting the EBP plots for perspective on what these plots tell us):


Please see Interpreting the EBP plots: The Threshold Effect, The Fixed-Outs Explosion, and other features to learn more about what these plots tell us.
There’s a catch
Unfortunately this formula was derived using four fictional teams that are too unlikely to possibly exist. Setting L=0 gives us the formula for the run production of The Homers, a hypothetical team that only ever hits home runs or strikes out. Setting L=1 gives us the formula for The Doublers, a hypothetical team that only ever hits doubles or strikes out, and makes no outs on the bases. Neither do they ever advance on the bases except because of a hit. Their first hit of an inning does not score a run, but every hit after that scores a run and leaves a runner on base. L=2 gives us the formula for The Singlers, who are just like The Doublers except they hit singles, and their first two hits of an inning don’t score. L=3 gives us the formula for The Walkers, whose first three base reaches of an inning (all by walks) don’t score.
Furthermore, every batter on each of these teams is assumed to have the exact same chance of reaching base as every other member of their team in every one of their plate appearances, regardless of who they’re facing at the time, or how they’re feeling at that moment.
Getting around the catch by combining the four formulas
Now you may be wondering, what good is a set of formulas that only apply to four fictional teams that are too unlikely to possibly exist? The answer is that individually, they aren’t much use, but when properly combined, they can simulate what an actual team does. That’s because each team has a little bit of The Homers in them, a little bit of The Doublers, and a little bit of The Singlers and The Walkers. If we can figure out, for example, that your favorite team is 10% Homers, 20% Doublers, 30% Singlers and 40% Walkers, then we just take 10% of The Homers’ formula (where L=0), add it to 20% of The Doublers’ formula (L=1), 30% of The Singlers’ formula and 40% of The Walkers’ formula to get the relationship between runs scored and OBP for your team. Well, that is, what the relationship would be if they never made outs on the bases (by double plays, getting picked off, getting caught stealing, etc.) and never made base advancements (by steal, wild pitch, balk, etc.). Mathematicians refer to this kind of combination of formulas as a linear combination.
How do we know how much of each formula to use in the combination?
So how much of each formula do we use? How do we make this linear combination?
It turns out that we need to recognize that the L=0 formula applies to more teams than just The Homers, and the L=1 formula applies to more teams than just The Doublers, etc. The key is to look at the number of base reaches in an inning, and the number of players left on base at the end of the inning. In our fictitious world in which no outs are made by players who have already reached base, the number of runs scored in an inning is always just the number of base reaches minus the number of players left on base. It doesn’t matter what the base reaches are; you can ignore those. If you know these two numbers – base reaches and number left on base – you know everything you need to know.
Think about an inning in which a team gets two walks followed by a triple. That inning ends up with three base reaches and one player left on base. So does an inning with three doubles, like The Doublers might get. In both cases, two runs score. You don’t have to be The Doublers for three base reaches and one left on base to mean two runs were scored; it means that for any team that exists in our fictional world of no baserunning.
If you look at how the formulas we’re talking about were derived, for example the L=1 formula, nowhere do we use the fact that the base reaches were assumed to be doubles. We only use the consequence of this assumption, which is one player left on base (if there were base reaches at all). We can therefore do away with the doubles assumption, and instead be less strict. Now we consider a team that always leaves one player on base (in innings in which they reach the threshold of scoring). We’ll still call them “The Doublers” because it’s a nice and concise name, but now we mean by that “Team that leaves one player on base”.
Unlike these fictional teams, real teams don’t leave the same number of runners on base every inning. But in every inning, they will behave just like one of these four more broadly-defined fictional teams. They will sometimes leave 0 runners on base, sometimes 1, sometimes 2, and sometimes 3. If we can predict what fraction of their innings will end up with each of these results, we’ll have the fractions of each formula to use.
So, how do we predict the fractions of innings in which a team will leave 0, 1, 2, and 3 runners on base?
Calculating what fraction of the first formula to use
These fractions we’re talking about, when put into a linear combination formula like this, are called coefficients. In our case, the formula looks like this:

The LOB0, LOB1, LOB2, and LOB3 are the four coefficients representing the likelihood of a team leaving 0, 1, 2, or 3 runners on base. EBP(L,p) is any of the three formulas mentioned at the beginning of this article.
Let’s see how the simplest of these coefficients is calculated. It’s the one for the L=0 formula, so it counts the fraction of innings in which no runners are left on base. Consider that if the last base reach of an inning is a home run, then nobody is left on base; if the last base reach of an inning is not a home run, then somebody is left on base. We only want the former; we therefore count all the innings that have a home run as the last base reach, and no others.
What fraction of all innings is that? The simplest assumption is that it’s just as often as any base reach for that team is a home run. And that’s a number we can look up, just by dividing the team’s total number of home runs by their total number of base reaches. If it’s 10% (as it is for some slugging teams), then your team is 10% Homers. You’ll combine 10% of the L=0 formula with some other percentages of the other three formulas (for L=1, 2, and 3) to complete the linear combination.
Calculating what fractions of the other three formulas to use
So that takes care of one fourth of our linear combination. We can complete the linear combination if we can predict how often your team is likely to leave one runner on base (therefore scoring as if L=1), two runners on base (so scoring as if L=2), and three runners on base (L=3). We can predict that by looking at what kinds of base reaches the last one, two, or three base reaches of an inning might be. We calculate how often each of these combinations occur, and how many runners each combination leaves on base. For example, if the last three base reaches of an inning are all walks, there will be three runners left on base. So the probability of the last three base reaches an inning being walks is a portion of the probability that three runners are left on base at the end of an inning. The probability of the last three base reaches being a double followed by two walks also adds to this probability, because it also results in three runners being left on base. Add up the probabilities of all the scenarios that result in three runners left on base to get the fraction of The Walkers that your team is, and therefore what number to use as the coefficient of the L=3 formula.
The calculation of all those possibilities gets quite complicated, and in parts of it we’ll have to consider how often a runner takes an extra base on a hit. For a more detailed explanation of how this is derived, including a handy reference chart, see the derivation of Expected Binomial Production left-on-base fractions.
The final expressions for these four coefficients are shown in the section below called The full formulation.
Naming the combination: Expected Binomial Production, or EBP
Because this won’t give us the actual relationship between OBP and run production for an actual team, but just a good approximation of the same, it will be useful to give this approximation a name so we can more easily make this distinction. I arrived at the name Expected Binomial Production for this, in part because the derivation of the formula is based on binomial theory, and in part because other choices would have given it a three letter acronym that is already in use for an established run estimator (and you can use Expected Binomial Production as a run estimator by plugging in a team’s value for p). I will use the three letter acronym EBP most of the time when referring it.
Ah, but I wrote down three formulas for EBP, not just one. How will we distinguish them?
When I write just “EBP”, I likely am referring to all three versions collectively, though I might mean just the formula for runs per inning. When I want to distinguish between the three versions, I’ll use


We’ll also see that there are two different ways to calculate EBP. Those will be called EBPt and EBPf, as will be explained below.
The full formulation
, , or , first look up the following numbers for that team:Now let EBP(L,p) represent any of the three sets of component formulas for runs per inning, runs per plate appearance, and runs per base reach,
![EBP_{IN}(L,p) =\ \dfrac{p^{L+1}}{1-p} [3 + 2L(1-p) + \frac{1}{2}L(L+1)(1-p)^2]](https://s0.wp.com/latex.php?latex=EBP_%7BIN%7D%28L%2Cp%29+%3D%5C+%5Cdfrac%7Bp%5E%7BL%2B1%7D%7D%7B1-p%7D+%C2%A0%5B3+%2B+2L%281-p%29+%2B+%5Cfrac%7B1%7D%7B2%7DL%28L%2B1%29%281-p%29%5E2%5D&bg=ffffff&fg=333A42&s=0&c=20201002)
![EBP_{PA}(L,p) = \dfrac{p^{L+1}}{3} [3 + 2L(1-p) + \frac{1}{2}L(L+1)(1-p)^2]](https://s0.wp.com/latex.php?latex=EBP_%7BPA%7D%28L%2Cp%29+%3D+%5Cdfrac%7Bp%5E%7BL%2B1%7D%7D%7B3%7D+%C2%A0%5B3+%2B+2L%281-p%29+%2B+%5Cfrac%7B1%7D%7B2%7DL%28L%2B1%29%281-p%29%5E2%5D&bg=ffffff&fg=333A42&s=0&c=20201002)
or
![EBP_{BR}(L,p)\ =\ \dfrac{p^L}{3} [3 + 2L(1-p) + \frac{1}{2}L(L+1)(1-p)^2]](https://s0.wp.com/latex.php?latex=EBP_%7BBR%7D%28L%2Cp%29%5C+%3D%5C+%5Cdfrac%7Bp%5EL%7D%7B3%7D+%C2%A0%5B3+%2B+2L%281-p%29+%2B+%5Cfrac%7B1%7D%7B2%7DL%28L%2B1%29%281-p%29%5E2%5D&bg=ffffff&fg=333A42&s=0&c=20201002)
Then the approximate dependence of run production on p for your team is:
where the “left on base rates”, the coefficients of our linear combination, are

![LOB1 = fT + (fD)[fH+fT+fD+(fS+fF)(f14D)] + (f1B)[fH+fT+(fD)(f24S)] + (fF)(fH)](https://s0.wp.com/latex.php?latex=LOB1+%3D+fT+%2B+%28fD%29%5BfH%2BfT%2BfD%2B%28fS%2BfF%29%28f14D%29%5D+%2B+%28f1B%29%5BfH%2BfT%2B%28fD%29%28f24S%29%5D+%2B+%28fF%29%28fH%29&bg=ffffff&fg=333A42&s=0&c=20201002)

![LOB3 = fS^2(fF+fS)(1-f13S)(1-f24S) + (fS)(fF)(1-f24S)[fS+fF+2(fD)] + (fF)(fD)(1-f14D)(fS+fF) + (fF)(fS+fF)(fS+fF) + (fF)^2(fD+fT)](https://s0.wp.com/latex.php?latex=LOB3+%3D+fS%5E2%28fF%2BfS%29%281-f13S%29%281-f24S%29+%2B+%28fS%29%28fF%29%281-f24S%29%5BfS%2BfF%2B2%28fD%29%5D+%2B+%28fF%29%28fD%29%281-f14D%29%28fS%2BfF%29+%2B+%28fF%29%28fS%2BfF%29%28fS%2BfF%29+%2B+%28fF%29%5E2%28fD%2BfT%29&bg=ffffff&fg=333A42&s=0&c=20201002)
You can treat the three take-an-extra-base rates f13S, f24S, and f14D as inputs to the formula using team seasonal data that is available on Baseball-Reference.com. You can alternatively give them fixed values by taking a historical average over all teams; in this case they are no longer inputs to the formula, but instead become part of the formula. When making them part of the formula, some good numbers for seasons 1955 through 2016 (there is a lot of leeway with these values) are
f13S = 0.32
f24S = 0.67
f14D = 0.43
For background on this formulation and insights into it, please see this derivation of the EBP left-on-base fractions.
Distinguishing the two different treatments of extra base rates
To distinguish the two ways of coming up with numbers for extra base rates when calculating EBP, we refer to them as EBPf and EBPt:
EBPf = Expected Binomial Production fixed, for which f13S, f24S, and f14D are fixed coefficients, part of the formula
EBPt = Expected Binomial Production team, for which f13S, f24S, and f14D are inputs using team seasonal data
Recall that previously we provided a subscript to disguish between formulas for runs per inning, runs per plate appearance, or runs per base reach. If at some point we need to indicate which of those we mean while also indicating which method of specifying extra-base rates that we’re using, we’d write as follows:


What EBP looks like for two real teams
Now we can have a look at what the p-dependence for actual teams would look like when plotted – at least as approximated by EBP. Below are the plots for the 1963 Houston Colt .45’s who have the lowest runs per base reach of any team from 1955 through 2016, followed by the plots for the 1994 Cleveland Indians, who had the highest runs per base reach of any team over those same years. In each case I’ve superimposed these graphs over the ones we showed before for the four components of EBP (L=0, 1, 2, 3).
Please see Interpreting the EBP plots for heavy doses of perspective on making sense of these plots.
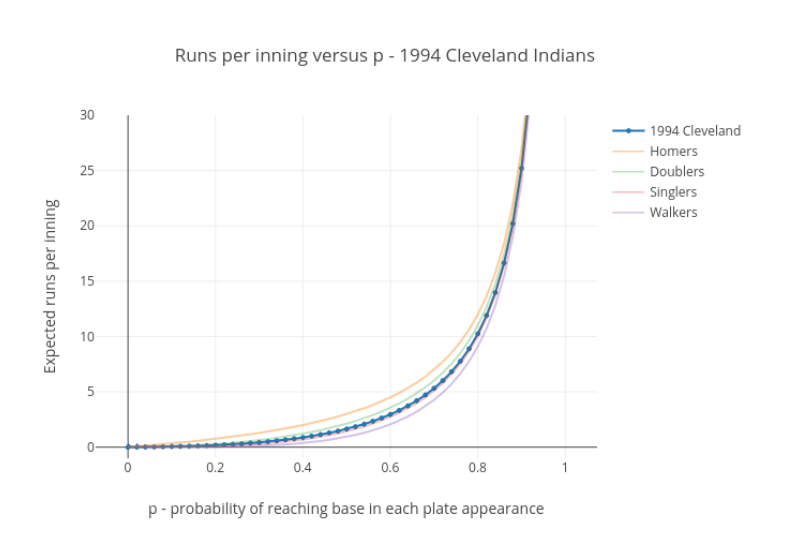
I’m guessing that most teams’ EBP curves will fall in between these two.
More about EBP
This article has spelled out what EBP is. We have a lot left to talk about – how it’s derived, adding meaning and context, exploring uses, assessing accuracy, and enumerating what might be done with it going forward. For more on EBP, please use the following links:
The meaning of each part of the EBP formulas
Full derivation of Expected Binomial Production component formulas
Derivation of Expected Binomial Production left-on-base fractions
Interpreting the EBP plots: The Threshold Effect, The Fixed-Outs Explosion, and other features
Other things you can do with EBP
Such as:
- Predicting runs for college teams, little league teams, minor league teams, etc.
- How changing the number of outs per inning would affect run production
- Strategy and lineup construction
- Predicting percentages of innings with a particular number of runs scored
- Predicting left on base rates
- Separating what happens at the plate from what happens on the basepaths
What might the OBP dependence of existing run estimators look like?
(COMING IN A WHILE) A comparison of run estimators and Expected Binomial Production
The accuracy of EBP and its potential for improvement
Closing remarks
I welcome any comments with ideas on how to proceed along one of the paths forward that I’ve spelled out, conversation on the same, and the results of any work you may do on the same. On Twitter I am @tomisphere.
Nearly all data used in the calculations described in this article came from Baseball-Reference.com, with a small amount of additional data coming from FanGraphs. In particular, calculating EBPt would have been impossible without the base-advance numbers provided by Baseball-Reference.com. I owe them my extreme gratitude.

This work deserves a larger audience. You put my own baseball math to shame!
Well done! I’m surprised at how tight the distribution is in the graph plotting Runs per inning vs OBP!
Also, I love that you’re doing this through mathematical derivations rather than regressions. I can see tools like this being great diagnostics for teams—allowing coaches to predict how their teams might perform when changing their emphasis, maybe from trying to hit homers to getting on base.
Hope to read more!
Thank you very much! I hope to write more, but finding the time is such a struggle. 🙂