Serves me right for basing an analysis on media rumors.
In two previous posts (here and here), I compiled hitting, baserunning, and defense statistics for every 2B/3B/SS candidate the Red Sox were connected with this offseason by various news articles. One possibility that never came up in those articles was Isiah Kiner-Falefa, so I didn’t include him. So of course that’s who the Red Sox sign. So I started creating this update to my previous comparisons, to include him.
That’s when things really got weird.
In rapid succession, the Red Sox claimed infielder/catcher Mickey Gasper off waivers, then infielder Tsung-Che Cheng, then infielder Brendan Rodgers, then traded infielder David Hamilton and two pitchers to the Brewers for infielder Caleb Durbin, infielder Andruw Monasterio, and infielder Anthony Seigler. That’s 7 new infielders with major-league experience acquired in a 6-day span, none of whom I’d provided any analysis for previously. So, I needed to do some serious updating. (And Red Sox prognosticators in the media need to seriously update their prognosticating game, because they were all very wrong.)
It took me a while, but here it is finally. I added the two who are likely to stay on the major league roster to the comparison of acquisition options. I’ve added all of them (except for Tsung-Che Cheng, who has played only 3 games in the majors) to a comparison of actual Red Sox infielders. I kept David Hamilton in that comparison, for now.
About this chart
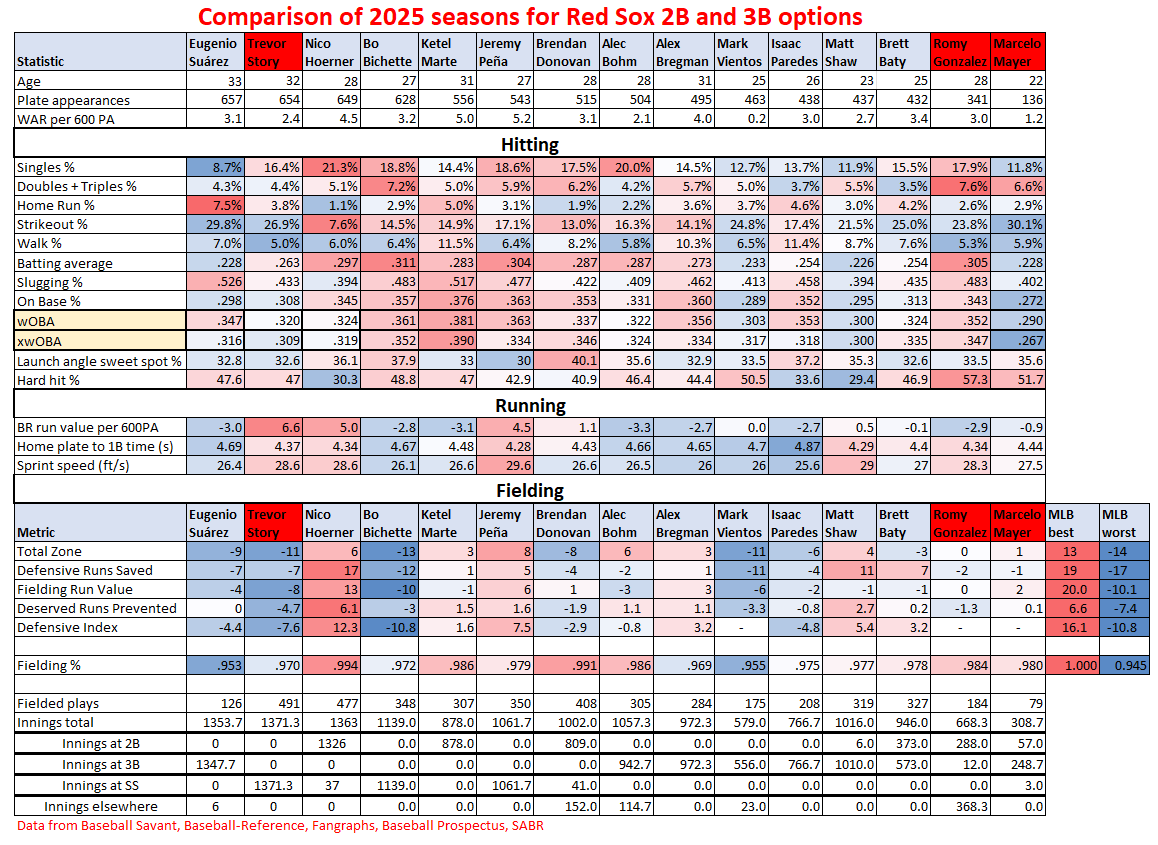
Numbers that are red are above average, the redder the better. Numbers in white are average. Numbers in blue are below average, the bluer the worse.
As before, the order was chosen based on number of plate appearances in 2025. Most on the left, least on the right. I made the header red for players currently on the Red Sox.
The WAR number has changed a bit. As before, “WAR” refers to the average of the Baseball Reference WAR, the FanGraphs WAR, and Baseball Prospectus’ WARP. But my projection to 650 plate appearances is not done by simply assuming each player would accumulate WAR at the same rate they did in their smaller number of plate appearances. There is a good reason for this. There is always some randomness in the results; some would refer to it as luck. While players with more plate appearances will see bigger swings in their totals due to luck, the size of those swings will be a smaller fraction of their overall numbers. So I switched from multiplying players’ WAR by
To multiplying by
This ensures the scaled up effects of luck are not bigger for players with low PA than they are for players with 650 PA, even though it likely underestimates what their full-year contribution would have been based on actual talent.
I made the same adjustment for the first two baserunning stats.
For fielding stats, the adjustment was to multiply by
The one exception was for DRP, where the folks at Baseball Prospectus seem to have done some adjusting already. For this, the best adjustment worked out to be multiplying by
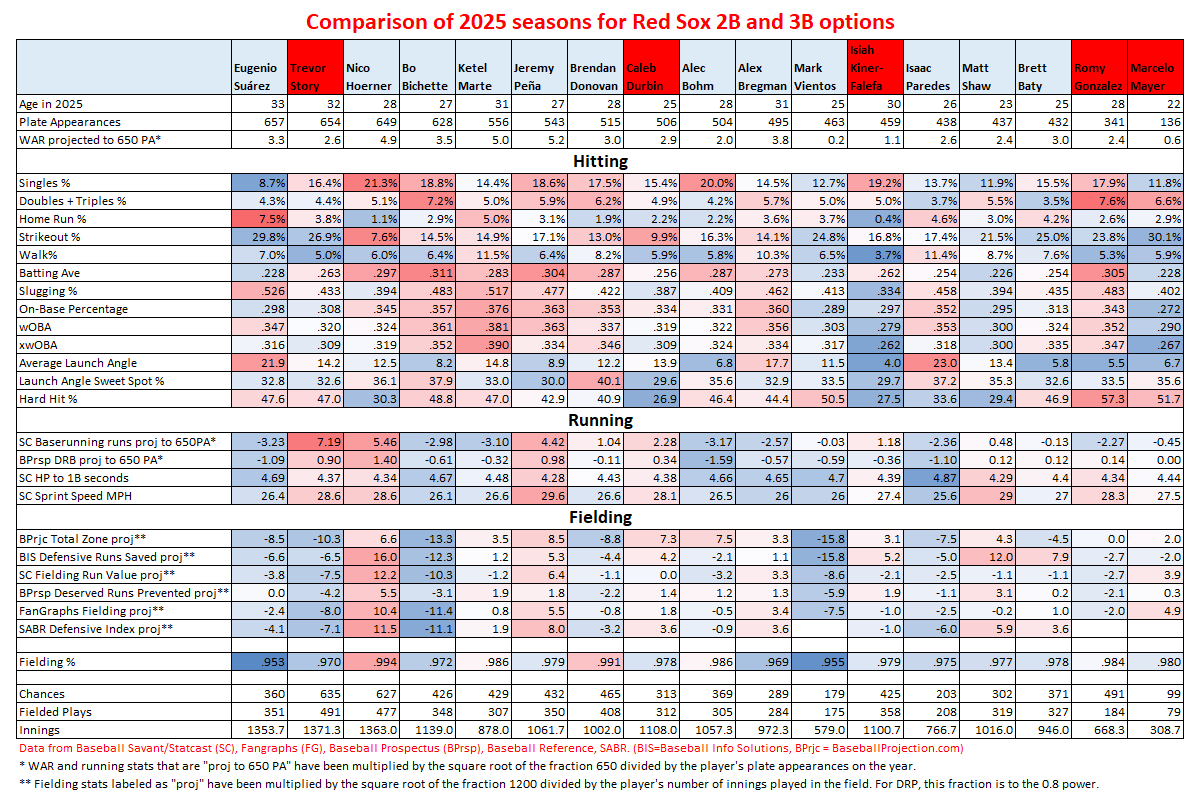
The Charts – comparing to other offseason targets
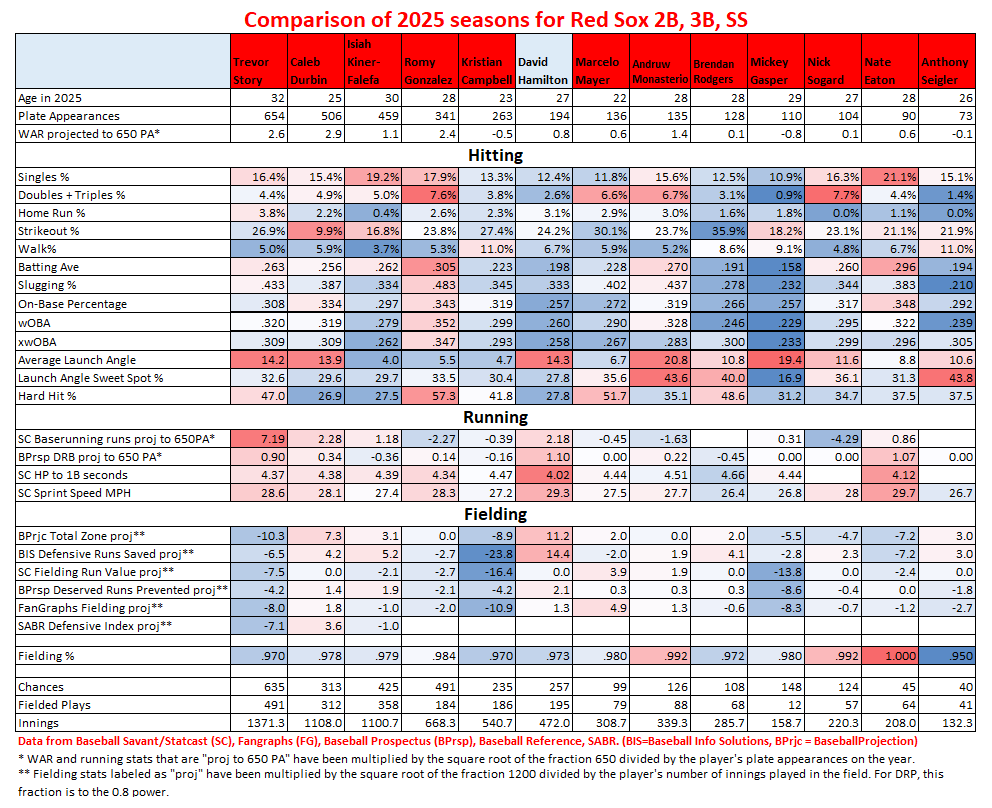
Here are the current top Red Sox “non-first-base” infielders (with red headers) compared to other players mentioned as potential offseason acquisitions.
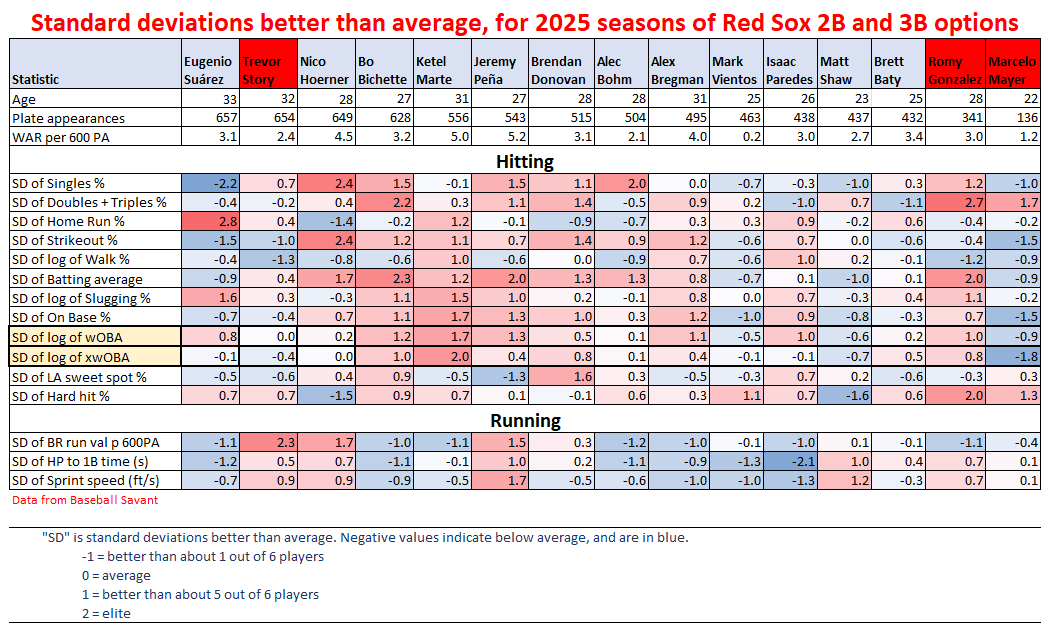
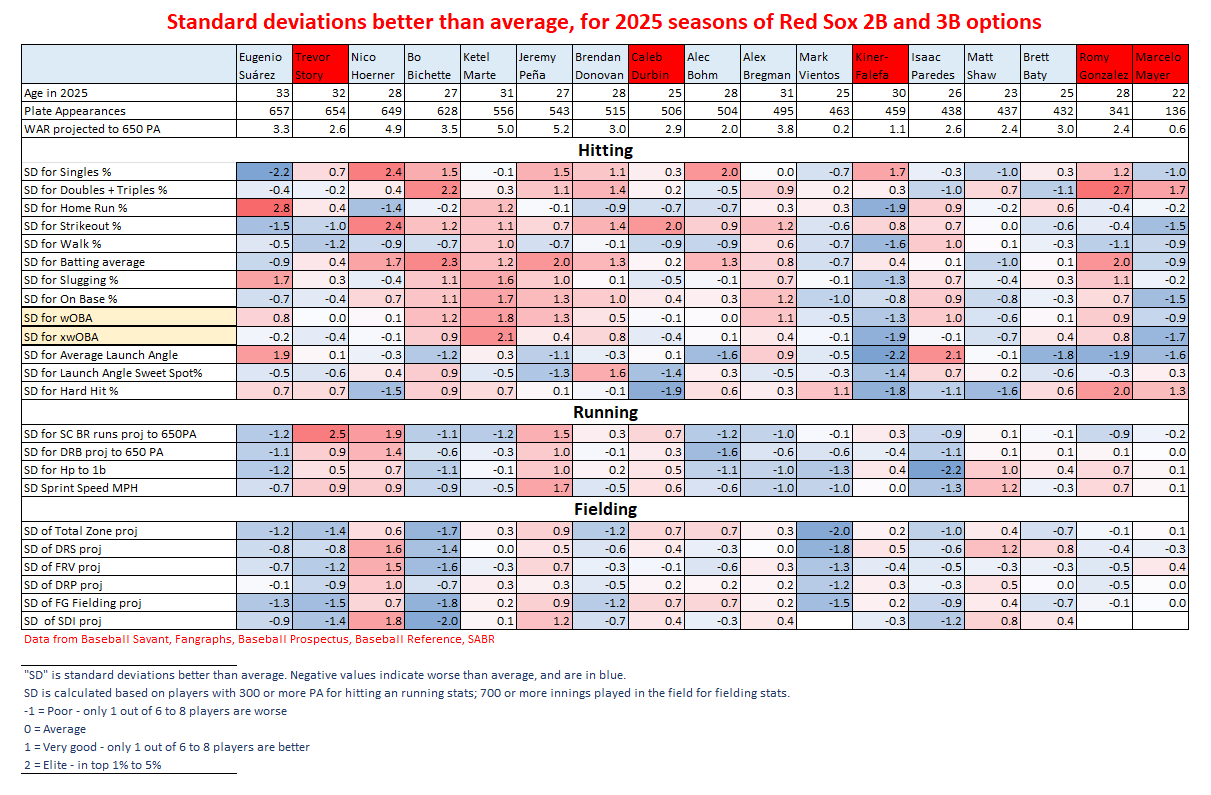
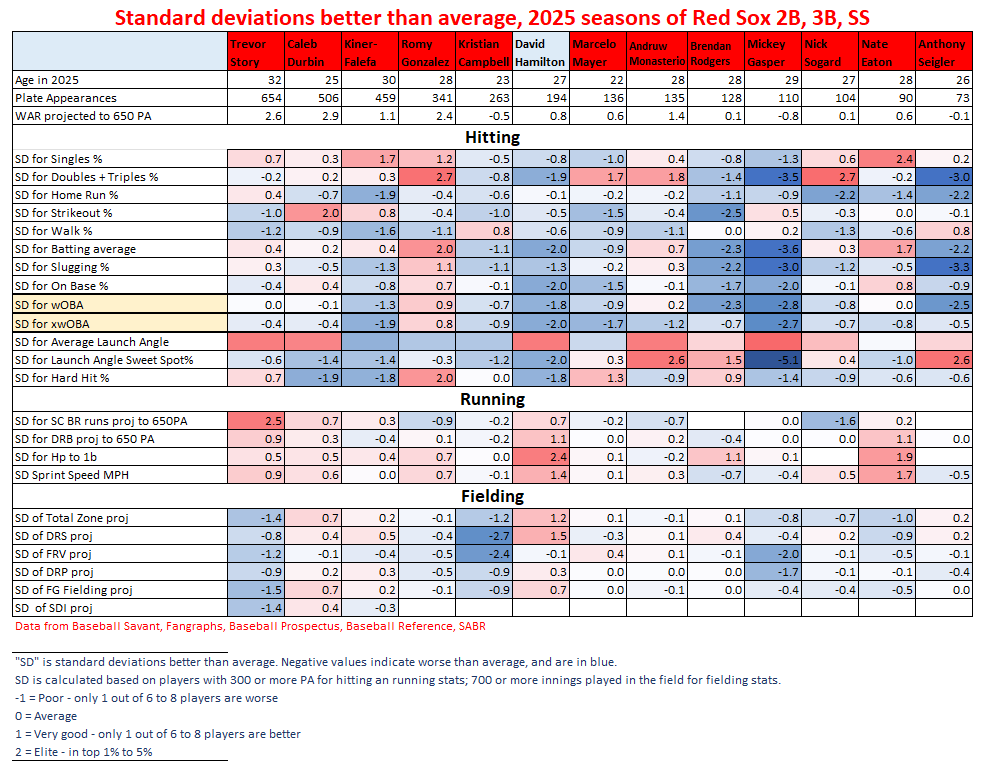
Here are the same stats expressed in standard deviations from the average. These numbers provide a standard way of telling how good a player’s stat is compared to the rest of the players in the MLB. (It also doesn’t suffer the problem that percentiles has, which is that what looks like a big difference for players average numbers looks like a small difference for players with the best or worst numbers. Although with the log-normal distributions, what looks like a big difference among the worst players will look smaller among the best players, though the effect is not expected to be as pronounced.)
First thing to note is that Kiner-Falefa is the worst hitter in this list. He looks like what Marcelo Mayer was in 2025, but with less power and a low strikeout rate. And Mayer is expected to get better. Kiner-Falefa gets a very high rate of singles; an average amount of doubles; a low strikeout rate, for a good batting average. But his extremely low walk and home run rates tanks the value of his bat. If they need a guy to put the ball in play, he’s a good choice. Otherwise, his bat has little value.
Caleb Durbin, on the other hand, had pretty much a league-average bat in 2025, with a very low strikeout rate. As he was a rookie, we can look for there to be improvement going foreward. His launch angle and hard hit numbers show there’s some room for improvement in squaring up the ball.
Durbin’s baserunning was above average; it’s about the 4th best on this list of 17 players. Kiner-Falefa’s was average or just above average.
Durbin was one of the top 5 fielders on this list, solidly above average. Kiner-Falefa’s fielding, as with baserunning, was more average or a little above average. Durbin played almost exclusively at third base, so it’s hard to say how he’d do elsewhere. Kiner-Falefa has played many positions in his career, and shortstop more than anywhere else, although as a fielder he’s been much better at second and third. He’s also a good outfielder. He’s even caught a lot in his career, though he’s not good at it.
On the whole, the Red Sox did well in picking up Durbin. He’s pretty much better in every way than Kiner-Falefa, and compares well to the other players on this list who fans coveted. He’s a 3-tool guy who could grow into being a 4 or 5 tool guy, if his bat improves. Definitely starter material, and young and controllable.
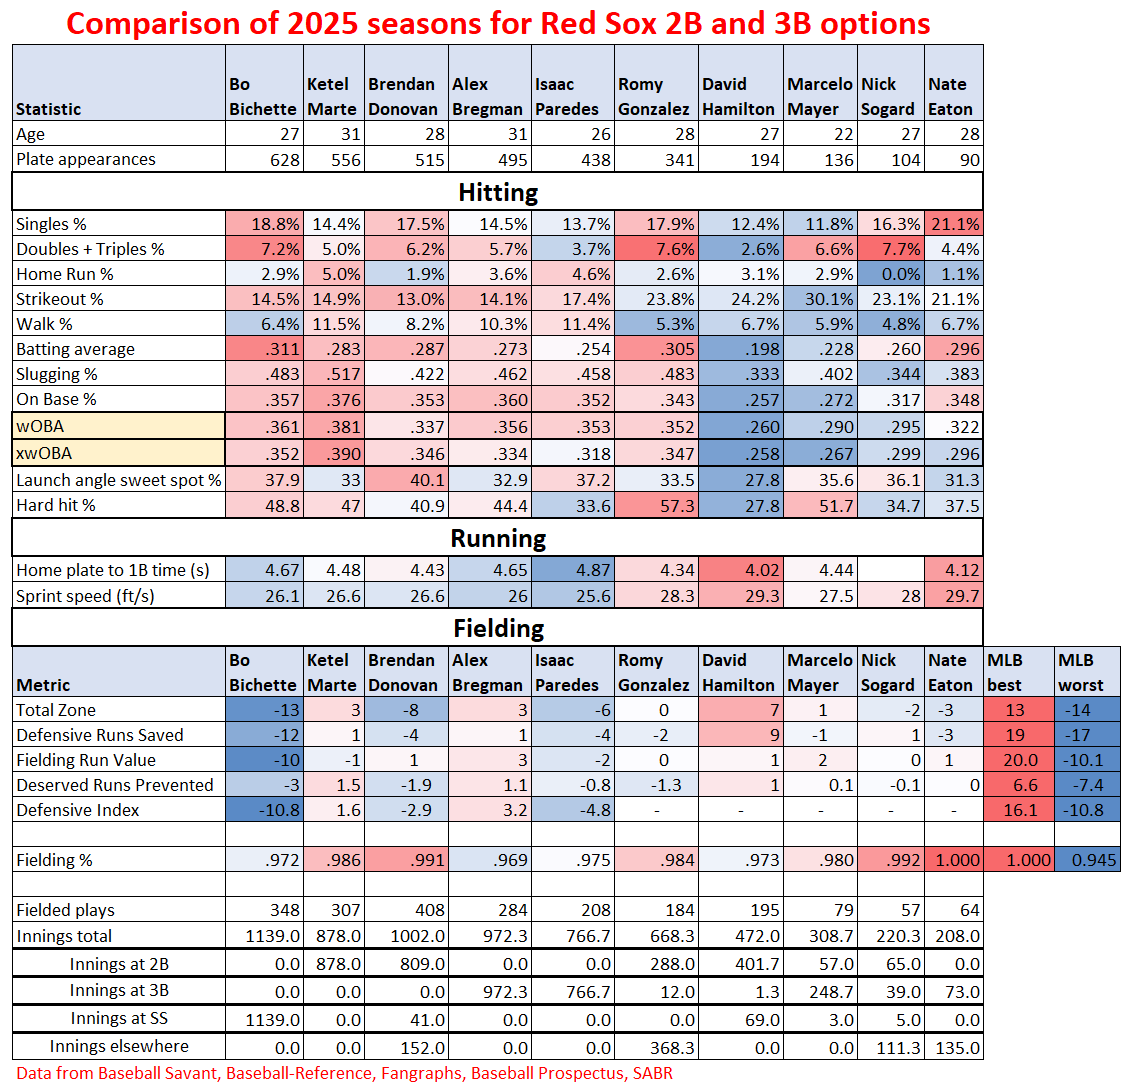
More charts – comparing to other Red Sox infielders
Here are the charts comparing all the new guys – Caleb Durbin, Isiah Kiner-Falefa, Andruw Monasterio, Anthony Seigler, Brendan Rodgers, and Mickey Gasper (leaving out Tsung-Che Cheng as he only played in 3 games) – to existing Red Sox infielders Trevor Story, Romy Gonzalez, Marcelo Mayer, Nick Sogard, Nate Eaton, and even Kristian Campbell (though I don’t think his 2025 is representative of who he will be – well you could say the same of Mayer). I’m keeping David Hamilton in for now, for comparison purposes. Again, this leaves out the first basemen.
By my judgement, the top three in this bunch are Trevor Story, Romy Gonzalez, and Caleb Durbin. Until Marcelo Mayer is more major-league ready, I would want to see those three get the lion’s share of the playing time.
There is an interesting comparison to be made between newcomer Andruw Monasterio and incumbent utility guys Romy Gonzalez and Nick Sogard. I’ll go into that in a little depth below. But first, here are a few quick notes about the other guys.
Some quick observations
The guy they gave up, David Hamilton, was the best defender of the bunch. He was also one of the three best baserunners. His bat was poor, but I had the feeling that it would have been better with regular playing time. We must remember that with more playing time in 2024, he had a league-average bat. His good launch angle gives him occasional pop.
Andruw Monasterio’s numbers look really close to Nick Sogard’s, with slightly better defense and more pop in his bat. It makes him an overall more valuable player, and they are close in age. Sogard’s a solid, hard-nosed backup player, but he could see less time on the roster now.
Brendan Rodger’s bat was not good, but historically it has been better. He especially has had good numbers against lefties, and that could get him some playing time on this roster that just lost lefty-mashers Rob Refsnyder and Alex Bregman.
Mickey Gasper was just awful. Anthony Seigler’s bat was not good. These guys are depth options only. Hoping we don’t see them in the majors, unless they somehow get better.
Nate Eaton is a very intriguing player. He may be primed for a breakout season. We’ll see.
Not sure what to expect from “Big 3” alums Kristian Campbell and Marcelo Mayer. Hopefully one of them turns the corner in 2026.
Gonzalez/Monasterio/Sogard similarities
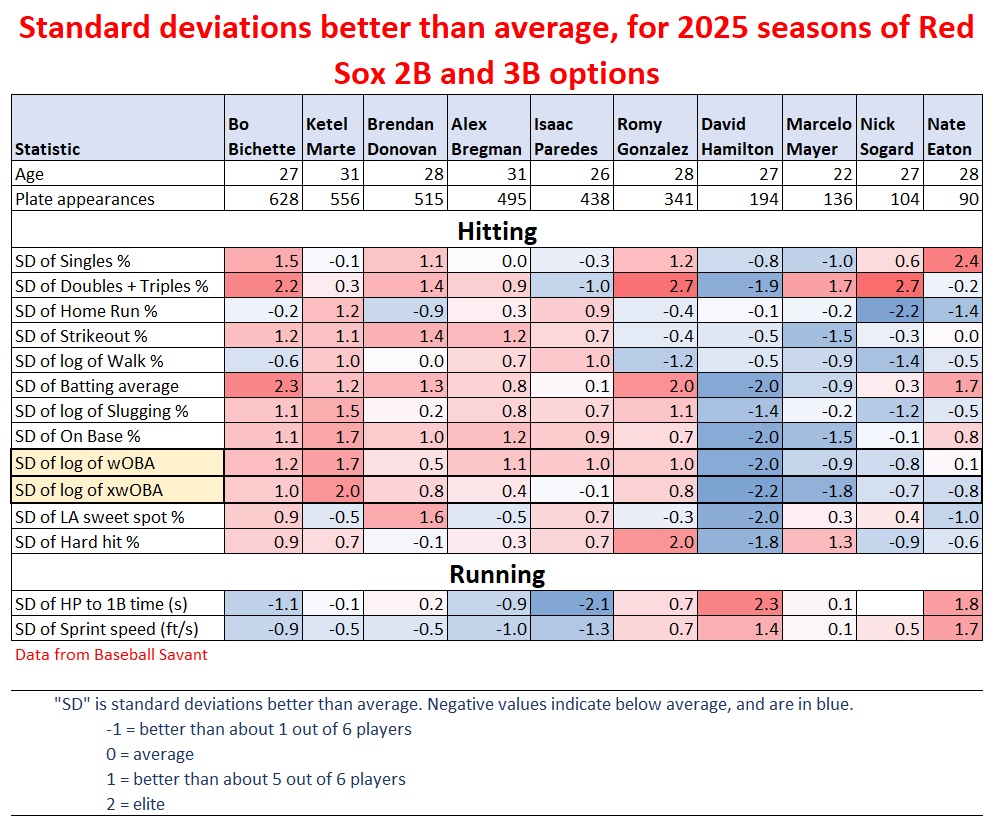
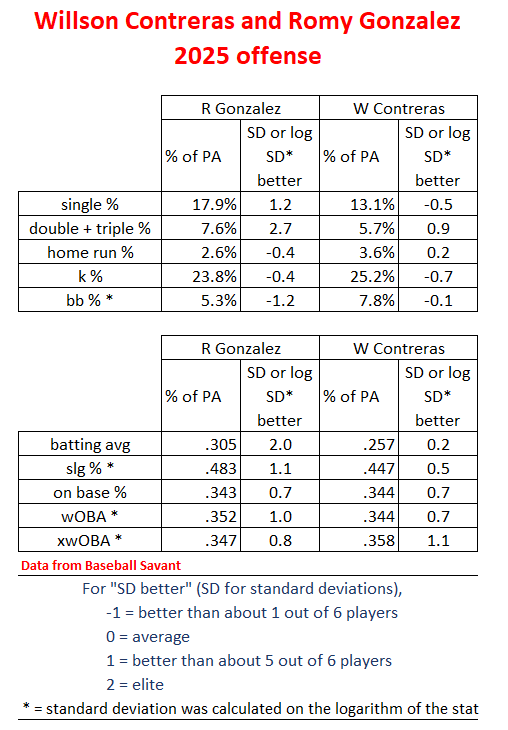
The top 5 lines of the hitting section of the chart break down the rates at which the hitters get different outcomes. Look at how similar those are for Romy Gonzalez, Andruw Monasterio, and Nick Sogard. Hang on, let me put together a version of the chart that has just those three players:
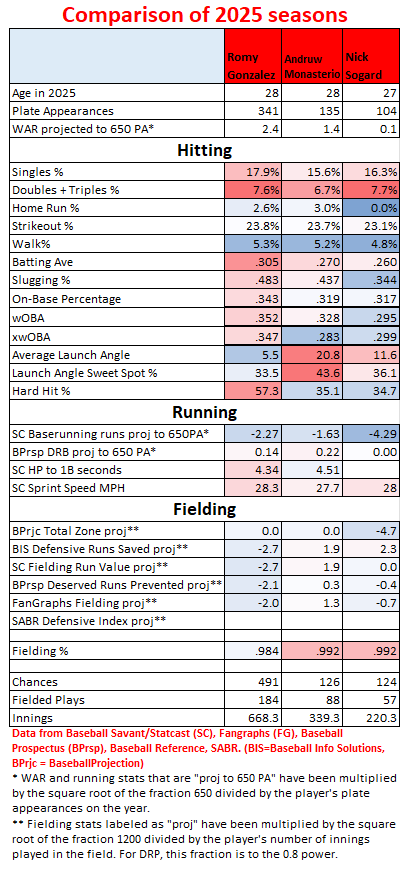
Those are very similar numbers in those top 5 hitting lines for singles, doubles & triples, home runs, walks, and strikeouts. Andruw Monasterio hits like Nick Sogard with more pop, and like Romy Gonzalez with fewer singles (his doubles numbers are a bit lower, but they should get boosted by Fenway Park, so I’ll consider them all equal there).
They’re all similar in age.
They’re all well-below-average baserunners despite having average to above-average speed.
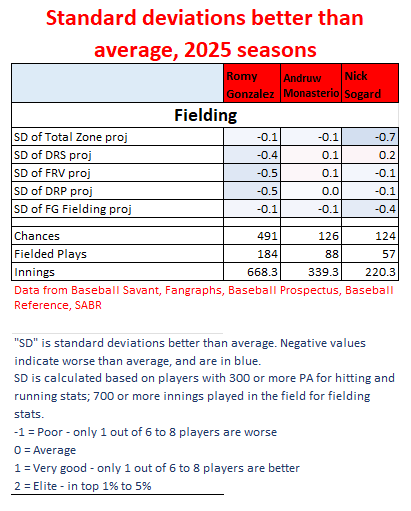
Monasterio stands out a bit on defense, though. While the numbers for their defensive metrics seem to be saying that Monasterio is a little above average defensively while Gonzalez and Sogard are a little below average, if we look at my chart that expresses these defensive metrics as standard deviations above or below average, we see it saying that Monasterio is average, while Sogard and Gonzalez are below average;
They are also all strong against left-handed pitching. While Sogard is a switch hitter and the other two are righties, their platoon splits are those of right-handed hitters. Here are tables of current Red Sox position players against LHP and RHP:
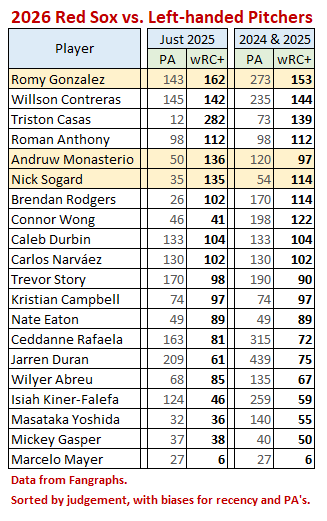
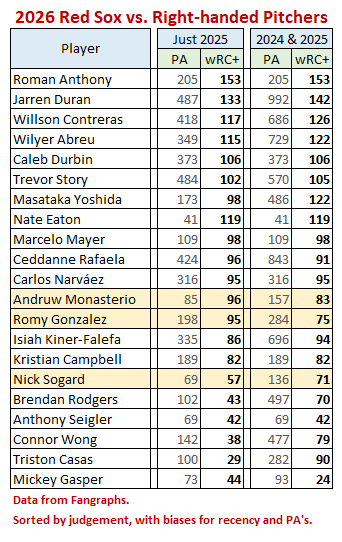
While Gonzalez is the clear leader against lefties, they’re all (at least recently) well above average against them. Gonzalez and Monasterio are approaching average against righties, with Sogard a good bit behind them.
All told, Andruw Monasterio represents an upgrade over Nick Sogard, and a good alternative to Romy Gonzalez, should Gonzalez not be fully recovered from injury by opening day. While fans may appreciate Sogard’s solid if unspectacular play, I expect they’ll be seeing less of him on the field for the Red Sox going forward.