
In my latest post on OverTheMonster, I explain why I think the Red Sox had a crisis of belief this season, and how two words from David Ortiz helped to cure it.
Author: tomisphere
Silver linings: despite losses, Eduardo Rodriguez still helping Red Sox win in September
Eduardo Rodriguez hasn’t earned a win in his last 9 starts, going back to mid-July. In that time, he’s had a good share of tough-luck losses and no decisions, none worse than September 4 against Oakland. Spinning a no-hitter through 7 and 2/3 innings, he finished having thrown 8 innings of shutout ball, the best start of his career. However, the Red Sox gave him exactly zero runs of support that day. This, the day after the Red Sox had scored 11 runs against the same team, and 16 the day before that. They would go on to lose 1-0.
And yet, it was not all for naught, because Rodriguez and the rest of the Red Sox starters strung together one excellent start after another to start September. By going deep into games, fewer innings were required of the relievers. By limiting runs allowed to at most 2 through the first seven games of September, the starters usually left the game with a big lead, allowing the Red Sox to pick and choose which relievers to use based on who was most rested, or who needed confidence-boosting. Some additional rest was already expected for the bullpen once rosters expanded September 1, but combined with the help from the starters, it was a perfect recipe for turning an overworked bullpen into a very well rested one.
The dividends from this rest were reaped Sunday night, as the bullpen was called on to take over at the start of the 4th inning of a close game against a potent offense and division rival in a tight pennant race. And they came through.
Let’s look at the numbers to see if they back all this up.
First, here are the performances of the Red Sox starters through the first 8 games of September:
| First 8 starts of September 2016 | |||||
|---|---|---|---|---|---|
| Date | Starting pitcher | IP | H | R | ER |
| 9/2/2016 | David Price | 7 | 4 | 2 | 2 |
| 9/3/2016 | Rick Porcello | 7 | 4 | 2 | 2 |
| 9/4/2016 | Eduardo Rodriguez | 8 | 1 | 0 | 0 |
| 9/5/2016 | Drew Pomeranz | 5.2 | 6 | 2 | 2 |
| 9/6/2016 | Clay Buchholz | 6.2 | 8 | 1 | 1 |
| 9/7/2016 | David Price | 7 | 6 | 2 | 2 |
| 9/9/2016 | Rick Porcello | 7 | 6 | 2 | 2 |
| 9/10/2016 | Eduardo Rodriguez | 6 | 4 | 3 | 2 |
Indeed, on the whole they went quite deep into games, and allowed very few runs. This allowed the Red Sox to use the bullpen as a whole much less:
| Per game usage averages | |||
|---|---|---|---|
| IP (starters) | IP (relievers) | Pitches (rel.) | |
| August | 6.30 | 2.49 | 44.3 |
| Sept (thru 9/10) | 6.79 | 1.83 | 28.6 |
The bullpen as a whole threw about 1/3 fewer pitches per game through the first part of September versus their August average. That’s a big reduction in workload. Factor in the expanded rosters, allowing three additional relievers to be used in early September (Koji Uehara, Joe Kelly, and Robby Scott), and the usage per reliever went down. Here are the number of appearances made per team game played in the month for each reliever. Only pitchers making relief appearances in both months are included.
| Appearances per team game though Sept 10 | ||
|---|---|---|
| Aug App/G | Sep App/G | |
| Brad Ziegler | 0.367 | 0.250 |
| Craig Kimbrel | 0.367 | 0.250 |
| Fernando Abad | 0.400 | 0.250 |
| Heath Hembree | 0.100 | 0.125 |
| Junichi Tazawa | 0.333 | 0.125 |
| Matt Barnes | 0.433 | 0.250 |
| Robbie Ross | 0.400 | 0.125 |
Except for Heath Hembree, who hadn’t been used much in August, the frequecy with which each reliever was called upon dropped by a third or more, for everybody. Rest for the weary!
Better yet, thanks to improved performances by these relievers, they became more pitch-efficient. With the exception of Brad Ziegler, the number of pitches thrown per game played by the team (not per game the pitcher participated in) dropped for each pitcher to between one sixth and one third of their previous August numbers. That’s a lot of rest!
| Pitches per team game though Sept 10 | ||
|---|---|---|
| Aug Pit/G | Sep Pit/G | |
| Brad Ziegler | 5.73 | 4.00 |
| Craig Kimbrel | 6.87 | 1.25 |
| Fernando Abad | 6.27 | 1.88 |
| Heath Hembree | 1.77 | 0.63 |
| Junichi Tazawa | 6.47 | 1.88 |
| Matt Barnes | 7.13 | 2.25 |
| Robbie Ross | 6.47 | 1.13 |
The performances got better, too. Per batter faced, the frequency of undesirable results went down, and the frequency of desirable results went up:
| Results per batter faced by relievers | ||||
|---|---|---|---|---|
| H | BB | SO | HR | |
| August | 22.1% | 11.2% | 24.8% | 2.7% |
| Sept (thru 9/10) | 18.6% | 3.4% | 33.9% | 0.0% |
Most importantly, the relievers’ overall earned run average went from poor to perfect:
| Relievers’ ERA | |
|---|---|
| ERA | |
| August | 4.70 |
| Sept (thru 9/10) | 0.00 |
Obviously, Sunday’s game threw off these low usage numbers. But that wasn’t such a bad thing, when you realize that none of these “previously overused” relievers had been called on more than twice over the previous 10 days. They’ll need to pitch occasionally, and pitch in some pressure situations occasionally, to stay sharp. With Uehara and Kelly back and throwing well, the Red Sox bullpen is suddenly looking like a strength.
The one thing remaining that the Red Sox have lacked is late-inning offense, especially in close games. If they can turn that around, they’ll have all facets of their game working well. That will make for an easy September, and an easy September will allow them to set themselves up to perform well in the playoffs.
Yes, there really is a surge in talented young baseball players now
Seems like the last 3 or 4 years there have been a lot of very excellent, very young baseball players in the major leagues.
Seems like, in that time, there has been a lot of talk about all the very excellent young baseball players in the majors, with Mike Trout and Bryce Harper leading the way. But our impressions are sometimes wrong, as analysis of the relevant data can reveal. So, to see if these impressions are right or wrong, I looked at the data.
The data agree, overwhelmingly.
Using Baseball-Reference.com, I looked at the highest-WAR seasons for players 22 and under from the last 40 years. Though rather than using WAR numbers outright, I scaled WAR to 150 games, to adjust for differences in playing time. Because WAR behaves more like a cumulative statistic, like hits, than a rate statistic, like batting average, this effectively converts it to a rate statistic. Because rate statistics are untrustworthy over small sample sizes, I only looked at seasons in which the player played in most of the games, so, at least 82 games.
Here are the top 40 such seasons from the last 40 years:
| Year | Player | Lg | Tm | Age | G | WAR | WAR/150 |
|---|---|---|---|---|---|---|---|
| 2012 | Mike Trout | AL | LAA | 20 | 139 | 10.8 | 11.7 |
| 2015 | Bryce Harper | NL | WSN | 22 | 153 | 9.9 | 9.7 |
| 1996 | Alex Rodriguez | AL | SEA | 20 | 146 | 9.4 | 9.7 |
| 1981 | Rickey Henderson | AL | OAK | 22 | 108 | 6.6 | 9.2 |
| 2013 | Mike Trout | AL | LAA | 21 | 157 | 8.9 | 8.5 |
| 1980 | Rickey Henderson | AL | OAK | 21 | 158 | 8.8 | 8.4 |
| 1998 | Alex Rodriguez | AL | SEA | 22 | 161 | 8.5 | 7.9 |
| 1983 | Cal Ripken | AL | BAL | 22 | 162 | 8.2 | 7.6 |
| 2014 | Mike Trout | AL | LAA | 22 | 157 | 7.9 | 7.5 |
| 2013 | Yasiel Puig | NL | LAD | 22 | 104 | 4.9 | 7.1 |
| 1998 | Andruw Jones | NL | ATL | 21 | 159 | 7.4 | 7.0 |
| 2015 | Francisco Lindor | AL | CLE | 21 | 99 | 4.6 | 7.0 |
| 1991 | Ken Griffey | AL | SEA | 21 | 154 | 7.1 | 6.9 |
| 2010 | Jason Heyward | NL | ATL | 20 | 142 | 6.4 | 6.8 |
| 2003 | Hank Blalock | AL | TEX | 22 | 143 | 6.4 | 6.7 |
| 2012 | Giancarlo Stanton | NL | MIA | 22 | 123 | 5.5 | 6.7 |
| 1982 | Tom Brunansky | AL | MIN | 21 | 127 | 5.6 | 6.6 |
| 2007 | Troy Tulowitzki | NL | COL | 22 | 155 | 6.8 | 6.6 |
| 2015 | Manny Machado | AL | BAL | 22 | 162 | 7.1 | 6.6 |
| 1999 | Andruw Jones | NL | ATL | 22 | 162 | 7.1 | 6.6 |
| 2005 | Grady Sizemore | AL | CLE | 22 | 158 | 6.6 | 6.3 |
| 2015 | Carlos Correa | AL | HOU | 20 | 99 | 4.1 | 6.2 |
| 2015 | Mookie Betts | AL | BOS | 22 | 145 | 6 | 6.2 |
| 2013 | Manny Machado | AL | BAL | 20 | 156 | 6.4 | 6.2 |
| 2001 | Albert Pujols | NL | STL | 21 | 161 | 6.6 | 6.1 |
| 1992 | Ken Griffey | AL | SEA | 22 | 142 | 5.8 | 6.1 |
| 1979 | Paul Molitor | AL | MIL | 22 | 140 | 5.6 | 6.0 |
| 1976 | Willie Randolph | AL | NYY | 21 | 125 | 5 | 6.0 |
| 1981 | Tim Raines | NL | MON | 21 | 88 | 3.5 | 6.0 |
| 1997 | Alex Rodriguez | AL | SEA | 21 | 141 | 5.6 | 6.0 |
| 1978 | Robin Yount | AL | MIL | 22 | 127 | 5 | 5.9 |
| 2008 | Evan Longoria | AL | TBR | 22 | 122 | 4.8 | 5.9 |
| 1987 | Barry Bonds | NL | PIT | 22 | 150 | 5.8 | 5.8 |
| 1977 | Chet Lemon | AL | CHW | 22 | 150 | 5.8 | 5.8 |
| 2002 | Austin Kearns | NL | CIN | 22 | 107 | 4.1 | 5.7 |
| 1978 | Jack Clark | NL | SFG | 22 | 156 | 5.9 | 5.7 |
| 2012 | Jason Heyward | NL | ATL | 22 | 158 | 5.8 | 5.5 |
| 2012 | Bryce Harper | NL | WSN | 19 | 139 | 5.1 | 5.5 |
| 2012 | Brett Lawrie | AL | TOR | 22 | 125 | 4.5 | 5.4 |
| 1979 | Lou Whitaker | AL | DET | 22 | 127 | 4.5 | 5.3 |
I then grouped these into 10 groups of 4 years. As it turns out, the period from 2012 to 2015 contains 5 of the top 10, 8 of the top 20, and 14 of the top 40 of these seasons, as shown by these charts. This, when the average group has 1 in the top 10, 2 in the top 20, and 4 in the top 40.
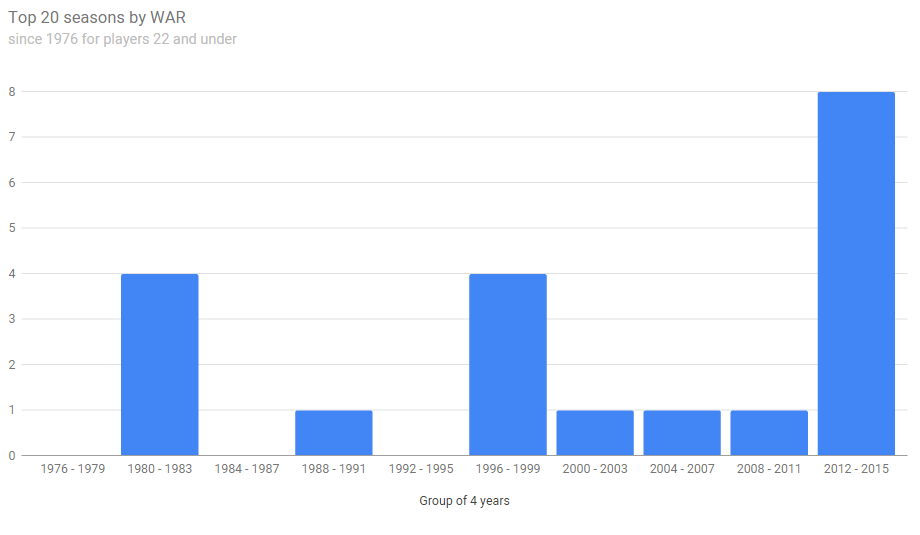

Of course, sometimes a single player produced more than one of these seasons. But these past four years also dominate in terms of the number of different young players on these lists. Here are all the players having top 40 seasons, listed under their 4-year groups, with their overall placements on the list next to their names. I’ve bolded those with top-20 seasons.
| 1976 – 1979 | 1980 – 1983 | 1984 – 1987 |
|---|---|---|
| Paul Molitor (27) | Rickey Henderson (4, 6) | Barry Bonds (33) |
| Willie Randolph (28) | Cal Ripken (8) | |
| Robin Yount (31) | Tom Brunansky (17) | |
| Chet Lemon (34) | Tim Raines (29) | |
| Jack Clark (36) | ||
| Lou Whitaker (40) |
| 1988 – 1991 | 1992 – 1995 | 1996 – 1999 |
|---|---|---|
| Ken Griffey (13) | Ken Griffey (26) | Alex Rodriguez (3, 7, 30) |
| Andruw Jones (11, 20) |
| 2000 – 2003 | 2004 – 2007 | 2008 – 2011 |
|---|---|---|
| Hank Blalock (15) | Troy Tulowitzki (18) | Jason Heyward (14) |
| Albert Pujols (25) | Grady Sizemore (21) | Evan Longoria (32) |
| Austin Kearns (35) |
| 2012 – 2015 | ||
|---|---|---|
| Mike Trout (1, 5, 9) | ||
| Bryce Harper (2, 38) | ||
| Yasiel Puig (10) | ||
| Francisco Lindor (12) | ||
| Giancarlo Stanton (16) | ||
| Manny Machado (19, 24) | ||
| Carlos Correa (22) | ||
| Mookie Betts (23) | ||
| Jason Heyward (37) | ||
| Brett Lawrie (39) |
Again, these past 4 years dominate.
Now that we know for certain that we’re experiencing a very special surge of young talent, the next thing to ask is, why? Has the surge in the amount of free analysis available (on the web and in ESPN in-depth commentary) over the last decade or so allowed parents to self-coach their youngsters more effectively? And is this finally coming to fruition? Or is this just a fluke? Is it a Cuban invasion? Or something else?
Xander Bogaerts back on pace to reach 200 hits, win AL batting title
Back on Wednesday morning, I showed that Xander Bogaerts and Miguel Cabrera were hitting at paces that would cause Bogaerts to (most likely) surpass Cabrera for the AL batting title. Though I didn’t mention it at the time, these projections also showed that he’d reach 200 hits even if he sat out a couple of games, and a few more than that if he played all the remaining games. After a pair of low-hit games knocked Bogaerts off that pace, his 3-for-4 performance last night has put him right back on it.
In trying to project future totals using “the pace at which a player is producing right now”, how many games do you use to determine what that pace is? The last 5? The last 10? 20?
I circumvent that question by using all of them … I calculate his pace of production over his last 5, 6, 7, 8, etc. games, then use that pace applied over the remaining number of games to be played to see what final numbers he’s headed for. This gives a big collection of possible final numbers; you then choose one in the middle.
On Wednesday I did that for Cabrera and Bogaerts using their paces of production as established by their last 8, 9, 10, etc. up to their last 20 games. That gave 13 paces of production for each player. I then applied these to their remaining games assuming they’d not sit out any games, and then again assuming they’d each sit out two games. I got these results:
| If playing all remaining games | ||
|---|---|---|
| Bogaerts | Cabrera | |
| Low | 0.327 | 0.324 |
| Median | 0.329 | 0.326 |
| High | 0.332 | 0.331 |
| If sitting out two games | ||
|---|---|---|
| Bogaerts | Cabrera | |
| Low | 0.327 | 0.326 |
| Median | 0.329 | 0.328 |
| High | 0.331 | 0.332 |
In all but one of these 26 projections, Bogaerts would end up with at least 200 hits.
I just updated these numbers, and now they look like this:
| If playing all remaining games | ||
|---|---|---|
| Bogaerts | Cabrera | |
| Low | 0.327 | 0.325 |
| Median | 0.329 | 0.326 |
| High | 0.330 | 0.332 |
| If sitting out two games | ||
|---|---|---|
| Bogaerts | Cabrera | |
| Low | 0.327 | 0.327 |
| Median | 0.328 | 0.328 |
| High | 0.329 | 0.332 |
Here are Bogaerts’ projected numbers of hits:
| Bogaerts projected 2015 hits | ||
|---|---|---|
| # of recent games used | If playing all games | If sitting two games |
| 20 | 204.0 | 200.8 |
| 19 | 203.3 | 200.2 |
| 18 | 203.0 | 200.0 |
| 17 | 203.3 | 200.2 |
| 16 | 203.6 | 200.5 |
| 15 | 204.0 | 200.8 |
| 14 | 205.1 | 201.7 |
| 13 | 204.9 | 201.5 |
| 12 | 203.8 | 200.7 |
| 11 | 204.4 | 201.1 |
| 10 | 204.0 | 200.8 |
| 9 | 204.7 | 201.3 |
| 8 | 204.3 | 201.0 |
Longer term projections (based on his last 40 or more games) almost all have him finishing with 200 hits exactly if he sits out 2 games, 203 hits if he plays all remaining games, and a .327 average.
If they play it out, and stay on pace, Bogaerts probably will win the batting title and will get to 200 hits.
Thanks to Baseball-Reference.com for the gamelog data I used for this article.
Xander Bogaerts on pace to surpass Miguel Cabrera for batting title
I’m a little frustrated with this article. I don’t think it gets me any closer to knowing how much of a shot Xander Bogaerts has at 2015 American League batting title. It just says, “it will be difficult”.
So I did some projections, to see what the numbers say. Of course, things have changed a bit since this article was published – the gap is now just 12 points instead of 18. There are 11 games left on the Tigers’ schedule, and 12 games left on the Red Sox’. I did two sets of projections. One assumes each player plays in all his team’s remaining games. The other assumes each player sits out two games.
In each case, I used the numbers of at bats and hits of each player in his last 8, 9, 10, etc. games, up to his last 20 games, as the basis for projecting his number of at bats and hits to come in his remaining games. I scaled these samples to the number of remaining games, added them to the current season totals, and calculated batting averages. So that made for 13 separate projections in each case. The results:
| Bogaerts projected 2015 AVG | ||
|---|---|---|
| # of recent games used | If playing all games | If sitting two games |
| 20 | 0.330 | 0.329 |
| 19 | 0.329 | 0.329 |
| 18 | 0.330 | 0.329 |
| 17 | 0.329 | 0.328 |
| 16 | 0.328 | 0.327 |
| 15 | 0.327 | 0.327 |
| 14 | 0.328 | 0.327 |
| 13 | 0.328 | 0.328 |
| 12 | 0.330 | 0.329 |
| 11 | 0.332 | 0.331 |
| 10 | 0.331 | 0.330 |
| 9 | 0.329 | 0.328 |
| 8 | 0.330 | 0.329 |
| Cabrera projected 2015 AVG | ||
|---|---|---|
| # of recent games used | If playing all games | If sitting two games |
| 20 | 0.328 | 0.329 |
| 19 | 0.327 | 0.328 |
| 18 | 0.326 | 0.328 |
| 17 | 0.324 | 0.326 |
| 16 | 0.324 | 0.326 |
| 15 | 0.325 | 0.327 |
| 14 | 0.326 | 0.328 |
| 13 | 0.328 | 0.329 |
| 12 | 0.326 | 0.328 |
| 11 | 0.324 | 0.326 |
| 10 | 0.325 | 0.327 |
| 9 | 0.327 | 0.329 |
| 8 | 0.331 | 0.332 |
In both cases, because Bogaerts is hitting well right now and Cabrera is hitting poorly, the projections show that Bogaerts will probably surpass Cabrera and win the batting title. The charts pictured below show the lowest, highest, and median projections among the 13 projections produced for each case.
| If playing all remaining games | ||
|---|---|---|
| Bogaerts | Cabrera | |
| Low | 0.327 | 0.324 |
| Median | 0.329 | 0.326 |
| High | 0.332 | 0.331 |
| If sitting out two games | ||
|---|---|---|
| Bogaerts | Cabrera | |
| Low | 0.327 | 0.326 |
| Median | 0.329 | 0.328 |
| High | 0.331 | 0.332 |
If both players hit at their current paces the rest of the way, Xander Bogaerts will surpass Miguel Cabrera for the 2015 AL batting title.
Who should AL Player of the Month be, Encarnacion or Bradley?
To think about who should be the American League player of the Month for August, we could start by looking at those with the highest OPS on the month (and at least 50 plate appearances):
| Player | Team | Pos | G | AB | R | H | 2B | 3B | HR | RBI | BB | SO | SB | CS | AVG | OBP | SLG | OPS▼ |
|---|---|---|---|---|---|---|---|---|---|---|---|---|---|---|---|---|---|---|
| Encarnacion, E | TOR | 1B | 23 | 86 | 23 | 35 | 11 | 0 | 11 | 35 | 9 | 15 | 0 | 0 | 0.407 | 0.460 | 0.919 | 1.379 |
| Ortiz, D | BOS | DH | 26 | 91 | 17 | 32 | 8 | 0 | 9 | 22 | 16 | 17 | 0 | 0 | 0.352 | 0.432 | 0.736 | 1.169 |
| Bradley, J | BOS | CF | 26 | 79 | 23 | 28 | 9 | 3 | 5 | 23 | 11 | 24 | 3 | 0 | 0.354 | 0.429 | 0.734 | 1.163 |
| Donaldson, J | TOR | 3B | 27 | 105 | 29 | 34 | 7 | 1 | 11 | 35 | 16 | 25 | 2 | 0 | 0.324 | 0.408 | 0.724 | 1.132 |
| Gutierrez, F | SEA | LF | 19 | 62 | 12 | 21 | 4 | 0 | 7 | 20 | 4 | 19 | 0 | 0 | 0.339 | 0.388 | 0.742 | 1.130 |
Based on offense alone, you have to pick Encarnacion, though Ortiz, Bradley, and Donaldson all show very well here. But can defense close the gap? Not for Ortiz, the DH, but maybe for Jackie Bradley Jr., the defensive wiz in the outfield. Now I haven’t seen Encarnacion’s defense this month, but I have to wonder, how likely is he to have made plays at first base in August like this catch:
Bradley Jr.’s incredible catch
or this catch:
Statcast: Bradley’s great grab
or this throw:
Statcast: Bradley Jr. gets Bird
or this catch:
Must C: Bradley Jr.’s great grab
or this throw:
or this catch:
or this throw:
Bradley Jr.’s throw nabs Infante
or this catch and throw:
Given the game-changing, run-saving nature of Bradley’s defense so many times in August, that has to propel him squarely into a two-person discussion for who should be AL player of the Month for August.
Do you think the pick should be Encarnacion, Bradley, or someone else?
Red Sox almost accomplish unusual feat
Over their last four games, the Boston Red Sox have posted scores of 15, 22, 8, and 2. Had it not been for a late rally last night, they would have finished the last of these games with just one run instead of two, and this would have made for what must be an uncommon if not unprecedented oddity. They’d have had four consecutive different scores, each one exactly 7 runs apart from the closest of the other scores.
What they did accomplish is probably also quite rare: four consecutive games in which no two scores are within 6 runs of each other. To see if any other team has ever accomplished this feat, I might look through Baseball-Reference.com’s play index for games with 18 runs scored or more and then look through game logs to see the scores of the adjacent games, but with over 300 results to look through, that’s more work than I can finish on my lunch break. So I leave it to you, baseball community: can you find any team that has done this before?
Closure for Lester (he finally gets a hit)
As the season opened I reported on Jon Lester’s potential to break the record for most hitless at bats to start a career this season, now that he’s batting regularly as a National League pitcher. Later, I reported on his breaking that record. Now, at last, there is closure. On Monday Jon Lester got his first career hit, and it was off former teammate John Lackey (literally – it ricocheted off Lackey). He tallied 30 AB and 30 plate appearances this season before getting that hit, adding to his prior career totals of 43 PA and 36 AB without a hit.
Here is the new top 10 list:
| Name | Team(s) | Pos | PA | AB | First hitless game | Last hitless game | Hitless Games | RBI | SO | BB | HBP | SH | SF |
| Jon Lester | BOS-OAK | P | 73 | 66 | 6/16/2006 | 7/1/2015 | 30 | 1 | 37 | 1 | 0 | 5 | 1 |
| Joey Hamilton | SDP | P | 66 | 57 | 5/24/1994 | 6/3/1995 | 24 | 1 | 34 | 2 | 0 | 6 | 1 |
| Ron Herbel | SFG | P | 63 | 55 | 5/6/1964 | 5/11/1965 | 27 | 0 | 36 | 2 | 0 | 6 | 0 |
| Marv Breuer | NYY | P | 57 to 60 | 47 to 49 | 4/27/1940 | 9/4/1940 | 20 | 1 | 22 or 23 | 4 or 5 | 0 | 6 | |
| Luke Walker | PIT | P | 56 | 48 | 4/18/1966 | 4/18/1970 | 27 | 2 | 29 | 2 | 0 | 6 | 0 |
| Don Carman | PHI | P | 53 | 48 | 9/13/1984 | 5/11/1987 | 28 | 0 | 21 | 0 | 0 | 5 | 0 |
| Fred Gladding | DET-HOU | P | 49 | 47 | 7/1/1961 | 7/5/1969 | 40 | 0 | 27 | 0 | 0 | 2 | 0 |
| Chris Short | PHI | P | 45 | 44 | 4/19/1959 | 6/24/1961 | 26 | 0 | 19 | 0 | 0 | 1 | 0 |
| Randy Tate | NYM | P | 47 | 41 | 4/14/1975 | 9/18/1975 | 23 | 0 | 22 | 1 | 0 | 5 | 0 |
| Pat Jarvis | ATL | P | 45 | 41 | 8/13/1966 | 6/12/1967 | 18 | 1 | 24 | 2 | 0 | 2 | 0 |
Congratulations, Jon. You’ve hit some balls pretty hard to this point in your career, and streak records like this one always involve some luck, either bad or good. Now forget about hitting, because you’ve got more important concerns.
Mookie Betts challenge to a Red Sox record may have been ruined by a bad call
Mookie Betts is closing in on a Red Sox team record. Or at least he should be. The record would be for consecutive multi hit games, and Mookie should now have 7 of these in a row, two shy of the team record of 9. However on June 17 in Atlanta, Mookie was called out on a bunt hit in the second inning that replays clearly show was an unmistakably bad call. The Red Sox had blown their challenge in the first inning, however, so the call stood, despite manager John Farrell’s pleadings to the umpire to review the call. The play went as a sacrifice, so it didn’t cost him an at bat; Betts would finish the game with one official hit. Officially, his multihit streak now stands at 4 instead of 7 because of this. Here are his official stats over these 7 games:
|
Name |
Dates |
Year |
Games |
AB |
R |
H |
2B |
3B |
HR |
RBI |
SO |
BB |
BA |
OBP |
SLG |
OPS |
|
6/15-6/21 |
2015 |
7 |
31 |
8 |
18 |
3 |
2 |
2 |
7 |
1 |
1 |
0.581 |
0.594 |
1.000 |
1.594 |
Where would he be on the Red Sox all time list had this call been corrected? The chart below shows all Red Sox multiple-hit game streaks of 7 or more since 1914, courtesy of Baseball-Reference.com. Betts’ numbers as they would have been are added in here. (Though there are likely a few more from before 1914 that should be added to this list, we know none of those missing streaks exceed 9 games, thanks to this SABR article.)
|
Name |
Dates |
Year |
Games |
AB |
R |
H |
2B |
3B |
HR |
RBI |
SO |
BB |
BA |
OBP |
SLG |
OPS |
|
5/20-5/29 |
2007 |
9 |
40 |
11 |
19 |
8 |
0 |
3 |
8 |
6 |
2 |
0.475 |
0.500 |
0.900 |
1.400 |
|
|
5/1-5/9 |
1978 |
9 |
35 |
11 |
20 |
3 |
2 |
5 |
17 |
3 |
2 |
0.571 |
0.590 |
1.200 |
1.790 |
|
|
6/17-6/23 |
1934 |
9 |
39 |
11 |
22 |
7 |
0 |
0 |
11 |
0 |
2 |
0.564 |
0.585 |
0.744 |
1.329 |
|
|
4/28-5/6 |
1940 |
8 |
34 |
12 |
18 |
5 |
2 |
1 |
11 |
1 |
3 |
0.529 |
0.568 |
0.882 |
1.450 |
|
|
6/19-6/25 |
1933 |
8 |
36 |
11 |
18 |
3 |
1 |
1 |
6 |
4 |
2 |
0.500 |
0.526 |
0.722 |
1.249 |
|
|
8/3-8/19 |
1914 |
8 |
26 |
4 |
17 |
3 |
0 |
0 |
5 |
4 |
2 |
0.654 |
0.679 |
0.769 |
1.448 |
|
|
6/15-6/21 |
2015 |
7 |
32 |
8 |
19 |
3 |
2 |
2 |
7 |
1 |
1 |
0.594 |
0.606 |
1.000 |
1.606 |
|
|
7/24-7/31 |
2011 |
7 |
32 |
7 |
17 |
2 |
0 |
1 |
10 |
3 |
2 |
0.531 |
0.556 |
0.688 |
1.243 |
|
|
7/3-7/10 |
2004 |
7 |
38 |
12 |
22 |
1 |
0 |
3 |
8 |
1 |
0 |
0.579 |
0.579 |
0.842 |
1.421 |
|
|
5/15-5/22 |
1996 |
7 |
33 |
8 |
15 |
1 |
0 |
5 |
11 |
7 |
3 |
0.455 |
0.500 |
0.939 |
1.439 |
|
|
5/22-5/29 |
1993 |
7 |
29 |
7 |
16 |
1 |
1 |
2 |
5 |
3 |
1 |
0.552 |
0.548 |
0.862 |
1.410 |
|
|
9/7-9/14 |
1987 |
7 |
28 |
5 |
16 |
2 |
0 |
1 |
3 |
0 |
1 |
0.571 |
0.567 |
0.750 |
1.317 |
|
|
8/10-8/17 |
1979 |
7 |
26 |
11 |
15 |
2 |
0 |
6 |
13 |
0 |
3 |
0.577 |
0.621 |
1.346 |
1.967 |
|
|
6/22-6/27 |
1965 |
7 |
29 |
6 |
16 |
6 |
0 |
2 |
6 |
3 |
4 |
0.552 |
0.606 |
0.966 |
1.572 |
|
|
9/6-9/12 |
1954 |
7 |
33 |
5 |
14 |
0 |
0 |
0 |
1 |
0 |
1 |
0.424 |
0.441 |
0.424 |
0.865 |
|
|
6/21-6/27 |
1951 |
7 |
28 |
11 |
16 |
5 |
1 |
0 |
10 |
0 |
5 |
0.571 |
0.636 |
0.821 |
1.458 |
|
|
5/2-5/7 |
1950 |
7 |
30 |
8 |
14 |
2 |
0 |
2 |
7 |
1 |
2 |
0.467 |
0.500 |
0.733 |
1.233 |
|
|
9/5-9/12 |
1942 |
7 |
35 |
10 |
18 |
5 |
1 |
0 |
6 |
1 |
2 |
0.514 |
0.541 |
0.714 |
1.255 |
|
|
8/26-8/31 |
1939 |
7 |
32 |
6 |
16 |
1 |
0 |
0 |
3 |
1 |
1 |
0.500 |
0.515 |
0.531 |
1.046 |
|
|
6/16-6/24 |
1939 |
7 |
33 |
10 |
15 |
0 |
2 |
0 |
2 |
0 |
1 |
0.455 |
0.471 |
0.576 |
1.046 |
|
|
9/2-9/6 |
1938 |
7 |
27 |
8 |
17 |
1 |
1 |
1 |
7 |
2 |
6 |
0.630 |
0.697 |
0.852 |
1.549 |
|
|
9/14-9/18 |
1931 |
7 |
29 |
6 |
15 |
6 |
0 |
1 |
8 |
1 |
1 |
0.517 |
0.533 |
0.828 |
1.361 |
|
|
6/27-7/1 |
1928 |
7 |
30 |
7 |
17 |
4 |
1 |
1 |
5 |
1 |
2 |
0.567 |
0.594 |
0.867 |
1.460 |
|
|
7/4-7/10 |
1922 |
7 |
32 |
2 |
14 |
1 |
1 |
1 |
6 |
0 |
0 |
0.438 |
0.438 |
0.625 |
1.063 |
|
|
8/8-8/16 |
1916 |
7 |
29 |
4 |
16 |
1 |
1 |
0 |
1 |
1 |
5 |
0.552 |
0.618 |
0.655 |
1.273 |
Tied for 7th, and possibly still counting.
Especially interesting are his overall offensive totals during this run. Only Jim Rice in 1978 (his best offensive year) and Fred Lynn in 1979 have higher OPS’s. And this brings a note of consolation. The best streaks on this list, going by OPS, came from players in the primes of their careers. Mookie, on the other hand, is just starting his career. In other words, he’s likely to get a few more shots at topping this list in the years to come.
His official streak of 4 is still going, and based on the above, Mookie Betts is about as hot a hitter right now as any Red Sox player has ever been. I’ll be watching tonight.
You should be out if your broken bat interferes with fielding a ball in play
I have long been troubled by the sight of an infielder in baseball trying to field a ball when pieces of the hitter’s bat are flying out onto the baseball field. Usually things end up the way they should, with the routine outs becoming outs, and the hits becoming hits. But just the same I often see a fielder hesitating to approach the ball in these cases, and I don’t think they should have to. The fielder shouldn’t have to choose between assuring his safety from being injured by flying wooden shards and making the play. That’s why I’d like to see a rule change to prevent having to make that choice.
Some years ago in an online forum I suggested that in such situations, the batter should be called out for interference. Specifically, if the batter’s bat or any portion of his bat interferes with or impedes a fielder’s ability to field a ball batted in fair territory, this by the judgement of the umpires, then the batter is out. There are already interference rules in the books; this would just extend them in what I think is a sensible way, which in my view is consistent with the existing interference rules. I’m making the call for this change again. Hopefully it will not only help fielders stay safe, but may also reduce the brittleness of some bats in use, so that we see fewer broken bats in the first place. Right now, there really isn’t a deterrent to using bats that are prone to breaking; it’s time to create one.
