A lot of names have been mentioned as possible second basemen or third basemen for the Boston Red Sox in 2026. Some are already on the roster (Marcelo Mayer); some could be added by trade (Ketel Marte, Brendan Donovan); some could be picked up as free agents (Bo Bichette, Alex Bregman).
There are other names on the current Red Sox roster that have played significant time at second and/or third base, but are not mentioned in articles about who will get regular playing time in the Red Sox infield. And I have issues with this. Specifically, I have issues every time I read that Marcelo Mayer is presumed to be the player who will round out the infield after they acquire a second or third baseman. Because when I look at what Romy Gonzalez did in 2025, I see a guy who is no longer a platoon player, he’s a guy that deserves to play every day. In addition to that, his elite hard-hit rate makes him a breakout candidate, and I’m saying that despite the fact that he was already the second-best hitter on the Red Sox in 2025. His defense is not bad, it’s good enough, and his baserunning is a plus. He’s proven at the major league level, in ways that Marcelo Mayer isn’t. He can be relied on to produce good results in ways that Marcelo Mayer can’t yet.
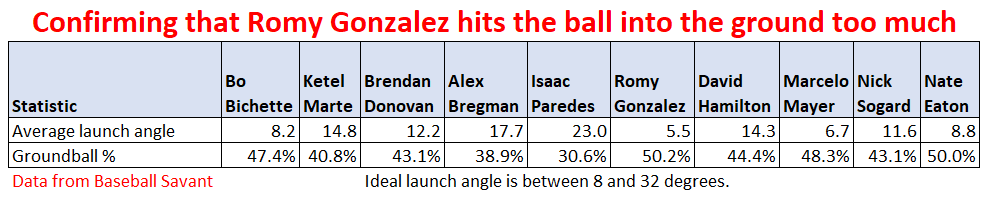
The thing that will allow him to break out? If he just stops hitting the ball into the ground so much. Of all the guys I’m comparing in this article, he does that the most. His average launch angle is the lowest. The result is that he’s one of the best in baseball at hitting doubles and triples, but his rate of home runs is a little below average.
He could also stand to chase less, and correspondingly increase his walk rate while decreasing his strikeout rate.
If you care about home runs, stikeouts, and walks, any of the 5 potential acquisitions (Bichette, Marte, Donovan, Bregman, Paredes) will be an improvement over Romy Gonzalez. But if you care about overall results at the plate, only Ketel Marte is looking like an improvement over Gonzalez. And when you factor in fielding and baserunning, there are some even bigger advantages for Gonzalez over most of these 5.
I’d hoped to discuss more specifics about comparisons of individual players, but I am finding it hard to find time to write this article. So I’ll just show you the tables I created to make these comparisons easy.
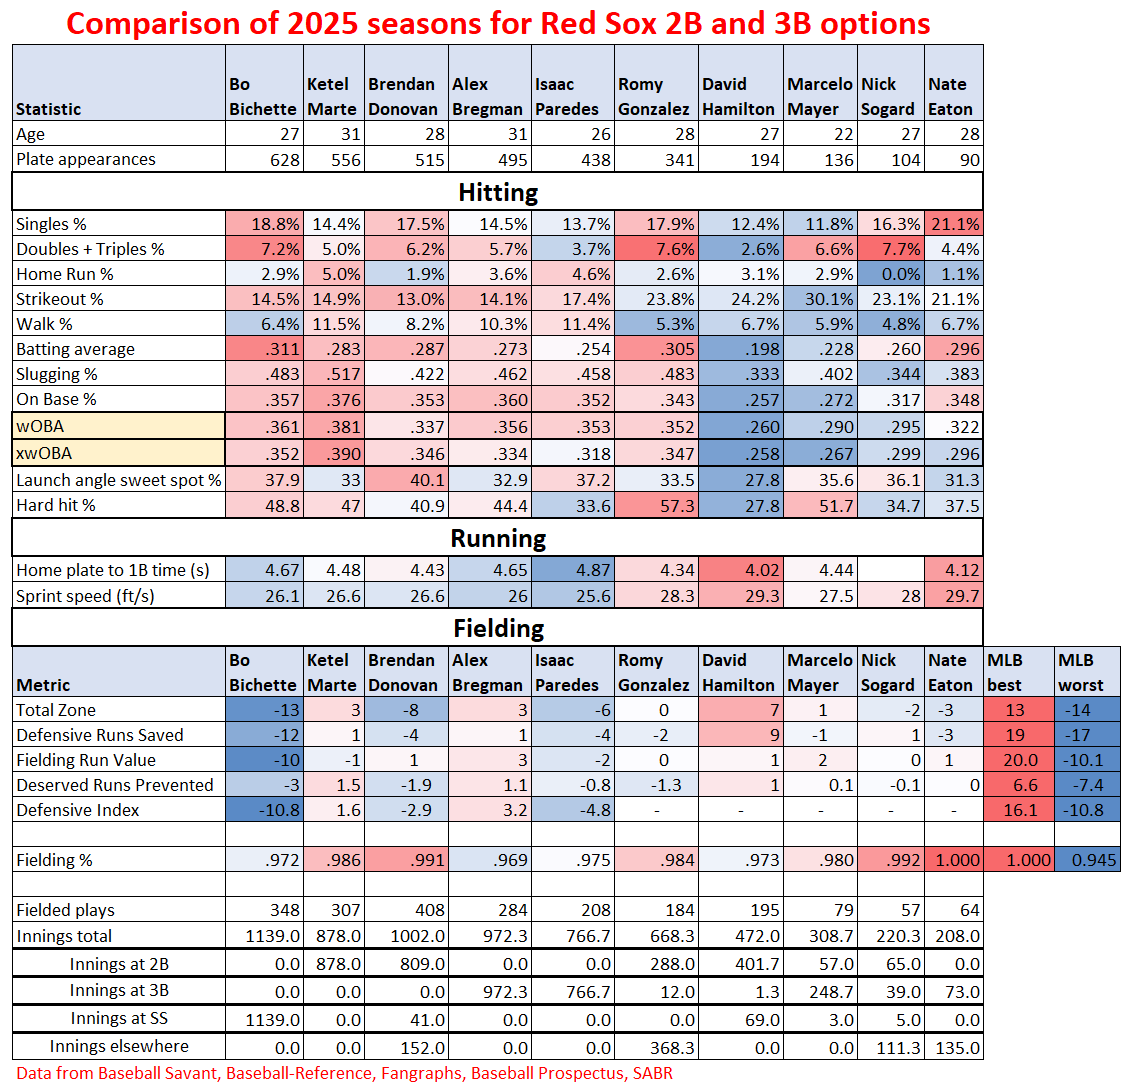
Here are the comparisons I’ve created for these players. The players are ordered left to right by most plate appearances in 2025.
Red means the number is above MLB average; blue means it’s below MLB average. White is MLB average. I set the deepest red to 2.8 standard deviations better than the mean (usually above, but sometimes below), and the deepest blue to 2.8 standard deviations worse than the mean. For hitting and baserunning, a table showing the numerical values of these standard deviations follows.
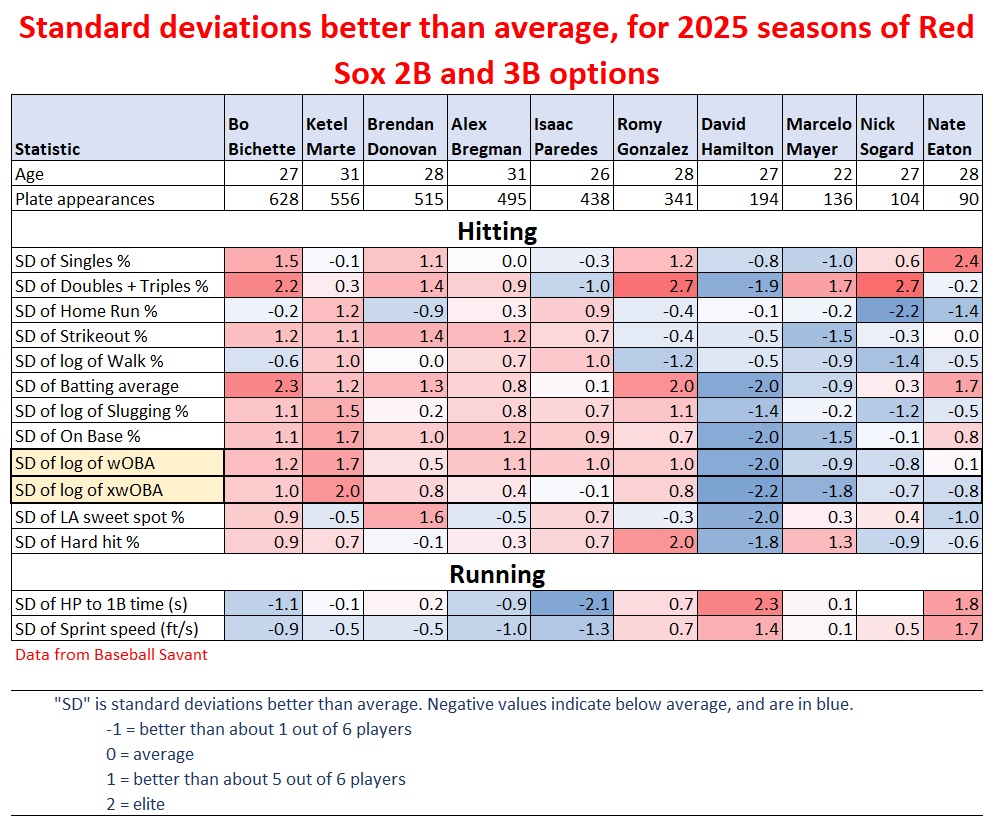
These same statistics expressed as standard deviations better (red) or worse (blue) than MLB average is below. In some cases, the data was more log-normal than normal, so I used standard deviations of the logarithm of the stat. These are labeled as such.
Here are the numbers supporting my previously mentioned statement that Romy Gonzalez can unlock a lot more power if he learns to elevate the ball. He hits it into the ground too much.
I hated the trade of Willson Contreras to my team, the Boston Red Sox, for RHP Hunter Dobbins, RHP Yhoiker Fajardo and RHP Blake Aita. The Red Sox got a good player who doesn’t improve the team, while giving a player who was a personal favorite.
Hunter Dobbins was my favorite pitcher on the Sox, not for how he pitched, but for the things he said. For the competitive fire. For the anti-Yankees fervor. He seemed promising as a #5 starter.
When I say that Willson Contreras doesn’t improve the Red Sox, that hinges on something that I get the feeling that nobody agrees with me on: that Romy Gonzalez has evolved into one of the top bats on the team, whose elite hard-hit rate could turn him into one of the top bats in the game if he could learn to elevate the ball a bit (he hits it into the ground too much). If you go by multi-year track record, people are right about Gonzalez and Contreras; but if you go just by 2025, as I do in my comments to follow, they’ve got Romy all wrong.
I’ve stated elsewhere, when you analyze it carefully, you see that Contreras is no better than Romy Gonzalez at first base. He’s a good player that the Red Sox didn’t need.
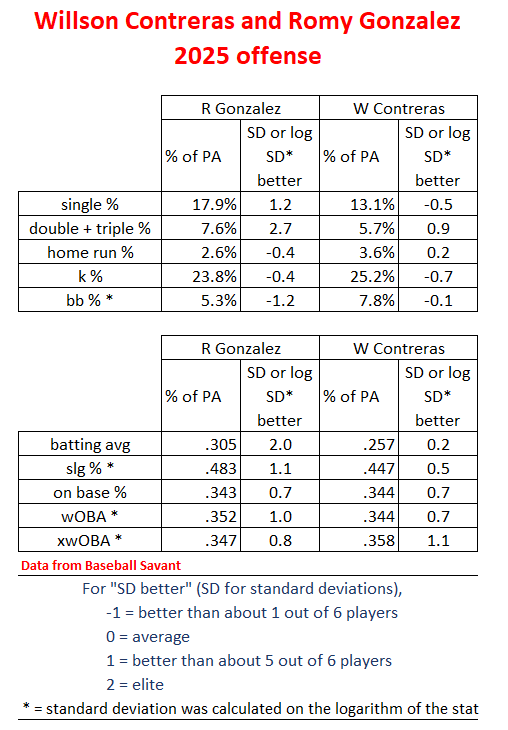
A key part of that statement is “at first base”. Romy’s best position defensively has always been first base, where he rates as average by all the different rating systems (he’s a below average fielder everywhere else). Contreras is effectively the same as Romy at 1B in Total Zone, Defensive Runs Saved, and Deserved Runs prevented. Only Statcast’s Fielding Run Value has him significantly higher, where he is a substantially above-average 4.
At the plate? They’re very similar in wOBA, Expected wOBA, and OBP. Contreras gets more walks and home runs, but not a ton more. Romy gets more singles, doubles, triples, and strikes out slightly less. They both chase too much.
Playing in Fenway, Contreras will probably see his doubles numbers catch up to Romy’s, but their home run numbers may get closer too. But Romy is just a slight adjustment away from unlocking a ton more power, as I mentioned above, with his elite hard-hit rate, but tendency to hit the ball into the ground.
Baserunning? Romy is clearly the better one here.
Positional versatility? Slight advantage to Contreras because it’s great to have an emergency backup catcher, but Romy is strong in this category too.
I figured, put Romy at first until Casas is ready, then work things out from there. Get one other infielder, preferably a third baseman, or a Ketel Marte. That would have been best. Anthony, Gonzalez, and Casas could all be giving the Red Sox power in spades if they can all be healthy.
Now instead, Romy plays second base where he’s worse defensively (I hope he gets better), and Casas is kind of blocked. Contreras may be a power hitter, but the Red Sox may not end up with any more power production for his acquisition.
By now, we have a lot of examples to look at to see how a hitter’s results change when leaving the Japanese baseball leagues to join Major League Baseball. So when I saw some fans getting excited about the prospects of their team signing position players Kazuma Okamoto or Munetaka Murakami this offseason, I decided to try to figure out how these two are likely to do in the MLB.
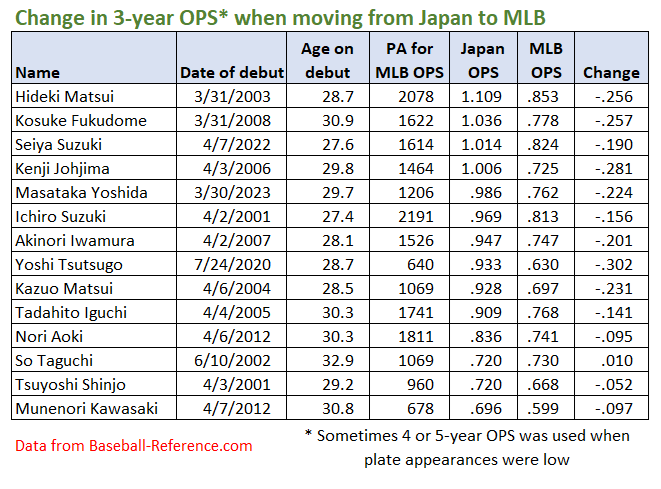
I found a nice page on Wikipedia that listed all the players who made that very switch. Nineteen of them were position players. I then ruled out any players that had less than 600 plate appearances in Major League Baseball, as that small of a sample size doesn’t inspire confidence that we’re getting an accurate measure of their ability in the MLB. That took 4 players out. I also ruled out all players who were too young when they came over for us to expect that their recent past performance would be at the same level as their near future performance. That ruled out just one player – Shohei Ohtani, who was only 23.7 years old when he played his first game in the majors. That’s almost 4 years younger than the next youngest, Ichiro Suzuki, who was 27.4. That left the 14 players you see in the following table:
These 14 players are listed in descending order of their OPS over their last 3 years playing in Japan just before coming to MLB. The three columns on the right are the ones we’re most interested in. It has their 3-year OPS in Japan, their first-3 (or first-4 or first-5) year OPS in MLB, and what the change in OPS was.
As you can see, in all but one case, the OPS comes down. And not just by a little bit – a .200 point drop is typical in this list. If you look closely, you’ll notice that the players who started with a higher OPS in Japan experienced the biggest drops.
Now let’s look at this data visually to see if we can spot any more trends. I’ve plotted each player’s OPS’s on the vertical axis, and their age at the time they started playing in MLB on the horizontal axis.
I can’t say I see an age-related trend here, except that perhaps the youngest have a slightly smaller drop than the older players. What does show is that trend we mentioned above, that the highest drops come from players with the highest OPS’s in Japan. As a rule of thumb, I’d say this:
If the player’s Japan OPS over the previous 3 years was over 1.000, expect a .200 to .275 point drop.
If it was in the .900’s, expect a .150 to .275 point drop.
If it was under .850, expect a .50 to .100 point drop.
This would be a good time to address some of the outlying data points.
Regarding So Taguchi, the only player whose OPS rose (if only by a paltry .010) upon coming to MLB. There are two things about his time in MLB that did not happen for any other player coming from the Japan leagues. The first is the unusual amount of time he spent in the minors his first two years. Going by plate appearances, he spent 96% of his first year in the minors, and 83% of his second year. Every other player to come over spend most or all of their time in the majors. Perhaps they saw some things they could improve with his plate approach? The other thing is how he was used. He was used almost exclusively as a late-innings replacement, and as such, he got a lot of favorable platoon matchups, much more than a full-time player would. This would have boosted his OPS – indeed, it was higher in the majors than in the minors!
Because the way they used Taguchi was so out of the norm, we can’t rely on his data point to inform us about typically-used players who cross over. So we’ll toss that out.
On the other end of things, there is Yoshi Tsutsugo and his .302 point drop, the biggest one in the chart. Is that a good data point? Notice it is based on only 640 major league plate appearances. That’s just above our cutoff amount. Did we pick a cutoff that was too low?
This may be a good time to point out that we may have a bit of survivorship bias happening here. There were four players we omitted from our data because their total plate appearnaces in the majors was below our 600-PA lower limit – in all cases, well below. Three of those four players had OPS drops of more than .300 points. But are those drops so large because the sample sizes are so small? Or were the sample sizes so small because the drops in OPS were so large? We can’t know for sure. And we can’t know if those large drops in OPS would have stayed that large with more plate appearances. All we can say is there might be a survivorship bias occuring here.
And that makes me inclined to keep the Yoshi Tsutsugo data point. It could be our lone representative of all the players whose play was so poor in MLB that they didn’t even play all that much in the end.
Okay, so so far, we’re taking So Taguchi out and that’s it.
Now it’s time to ask, where would Murakami and Okamoto land on this table and chart?
One thing about Murakami: he’ll be more than a year younger than anyone on this chart was on the day of their first MLB game. That could be a relevant difference. So it would be good now to bring back that data point we eliminated before, the player who was even younger when he started, Shohei Ohtani (you may have heard of him).
Here’s the new table with the three of them added:
Here’s the new plot with those three added and So Taguchi removed:
As you can see, I’ve added Murakami and Okamoto, with their OPS’s from their last 3 years in Japan showing, and a guess at where they’ll end up in the majors as a fuzzy orange patch. We can see that Ohtani did have a drop, but the smallest drop of anyone who started over .900 OPS. Was it because he was young, and young players are more likely to be improving with each year? Or was it because he is a unique human being who can master any new challenge he sets his mind to? Probably a little of both. As far as this impacts Murakami, it had me guessing on the smaller side for his OPS drop, but more closely aligned with Ichiro Suzuki’s, who he’s closest to in both starting age and starting OPS.
Okamoto’s drop puts him at a very MLB-average place. I hear he’s got excellent defensive skills: teams interested in him should know that his value will come from his defense, and not from his bat. This is especially important given that he plays positions that tend to be bat-first (corner infield, and outfield).
Murakami, by this analysis, looks to be an above average bat. But how much so? Enough to make up for his unimpressive defense and baserunning? Some have concerns about his ability to hit major league pitching, and his increasing whiff rate. Will teams look at him and see someone who would benefit from better coaching, coaching they may be able to provide? His raw power will still be there, and that may be enough for some to decide he’ll be a help to the team, and to believe they could improve the rest. If they can, he could become quite the acquisition. It’ll be interesting to watch.
Pete Alonso is one of the best bats in baseball, no question about that. But to get his bat at first base, you have to take with it his awful fielding and awful baserunning. That waters down his value to some extent. But by how much? And how does he compare to players currently on the Red Sox, and other available options?
I’ll present the data here and some other observations, so that you can compare. I’ll finish by talking about whether it makes sense for the Red Sox to add a player or stick with who they have. All the data shown here is from BaseballSavant.
The players to be compared
I picked the 3 first base free agents who were considered the best on the market when this offseason began, and put their stats on the top row of the comparisons below. (I started putting these together weeks ago when Josh Naylor was still a free agent.) On the bottom row I put a top first base trade possibility in Yandy Diaz, and the two top major league first base options on the Red Sox currently, Romy Gonzalez and Triston Casas.
For 5 of the players, I show their 2025 numbers. For Triston Casas, who didn’t play enough in 2024 and 2025 to give us a good idea of what he is, I show his 2023 numbers.
Expected stats
Let’s start with the expected stats. This is where they look at the velocity, launch angle and trajectory of every ball a player put in play, and tally up the probable results based on those numbers.
Focusing primarily on xwOBA, we see that all six players did well, although when you look at the actual values instead of the percentiles, Alonso is clearly separated from the pack, with only Triston Casas giving him a challenge there.
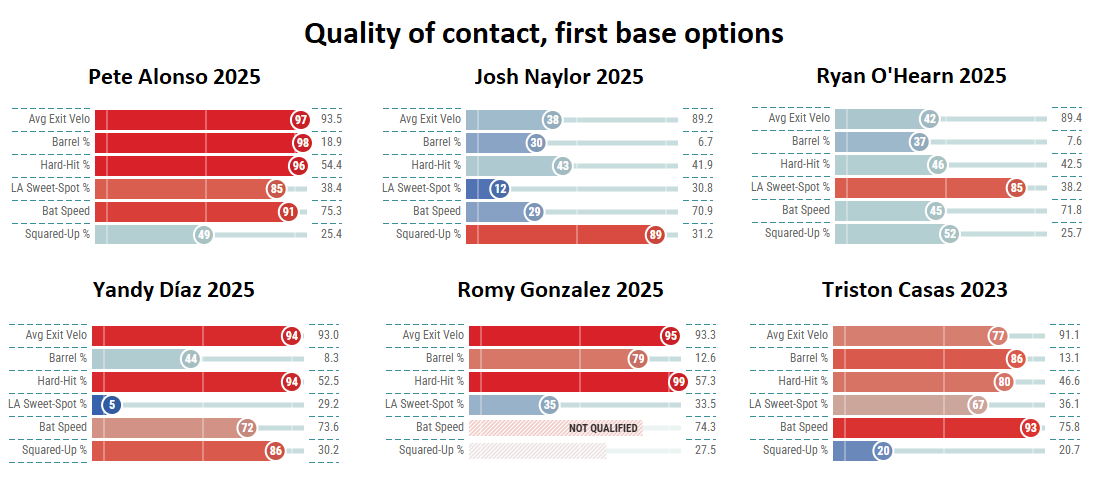
Quality of contact
Now we’ll look at quality of contact.
Alonso had the best overall contact, however Romy Gonzalez had more hard-hit balls. In fact he had the 5th highest Hard Hit% in baseball for players with over 300 PA. (Who was ahead of him? 1. Roman Anthony 2. Kyle Schwarber 3. Shohei Ohtani 4. Aaron Judge.) Yandy Diaz also hit it hard frequently.
But neither Gonzalez nor Diaz get an ideal launch angle (“LA Sweet Spot %”) as much as Alonso does. For both of them it turns out it’s because they hit too many ground balls – Diaz especially. This is likely the reason Diaz’s results aren’t as good as Alonso’s, and for Gonzalez, one of two reasons (we’ll see the other in the next section).
While O’Hearn and Naylor are limited by lower bat speed, O’Hearn improves his results by often having a good launch angle, and Naylor gets a better exit velocity by hitting on the sweet spot of the bat a lot.
Triston Casas’ 2023 comes the closest to Alonso’s 2025 among those pictured here. The differences may only be due to looking at a rookie season versus a veteran in his prime having his best season yet.
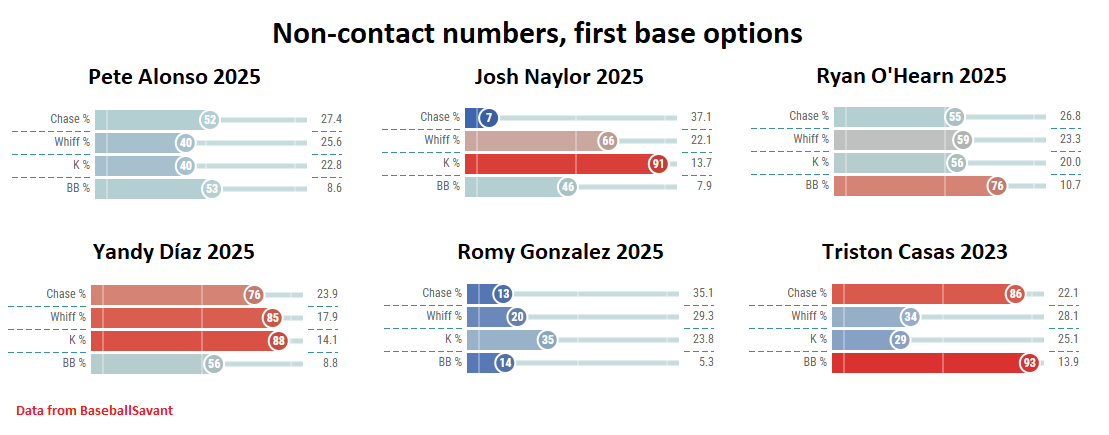
Non-contact stats
So that’s what happens when they swing and make contact. What about the numbers when they don’t make contact? Who chases pitches out of the zone too much (Chase %)? Who misses a lot when he swings (Whiff %)? Who walks too little or strikes out too much?
Alonso and O’Hearn are average in these categories. Yandy Diaz is above average, and Romy Gonzalez is well below average. Triston Casas has a great eye, but still manages to swing and miss at an above average pace. Josh Naylor doesn’t chase and doesn’t strike out, but walks an average amount.
Here we have what looks like the other reason Romy Gonzalez doesn’t get better results despite hitting the ball so hard. He chases too much. And while fixing that doesn’t necessarily fix his higher strikeout rate and low walk rate, it ought to at least help.
Fielding and Baserunning
What’s left? Fielding and baserunning.
Here again we see strong similarity between Triston Casas and Pete Alonso. They’re both terribly slow, and awful at both fielding and baserunning. But being slow isn’t the excuse for the rest, because look at Josh Naylor, who is even slower, but manages to be an average baserunner and a decent fielder.
When it comes to baserunning, Romy Gonzalez is the opposite of Josh Naylor. He’s the only one in this group that could be called “fast”, yet he’s still a poor baserunner. Maybe he should get a pointer or two from his teammate Trevor Story, who runs just as fast as Gonzalez but was one of the top baserunners in the game last year. Or maybe we should give him a little credit for being an average or above average baserunner in the past.
As for good fielders, it looks like Ryan O’Hearn is the only one, with Naylor and Gonzalez a little below average. But Gonzalez split his time between first and second base (and some other spots), and when you break his fielding down by position, both in his career and in 2025, he’s been an above-average fielding first baseman, and a below-average fielder everywhere else.
Categorizing these players
So to sum up, I see two basic types of player here.
Pete Alonso and Triston Casas are the power hitters who can get on base, too, but are awful at fielding and baserunning. Yandy Diaz is, too, but with a little less power and a little better baserunning.
In the other category are Josh Naylor and Ryan O’Hearn, who have some power, but not a lot, but still manage to have above-average impact as hitters. And at everything else, they’re average, on the whole.
The 2025 version of Romy Gonzalez belongs in the O’Hearn/Naylor camp, as a well-rounded player with an above-average bat. But he has the raw tools to become much better. He’s got enough speed to become a great baserunner. He’s one of the best in the game at hitting the ball hard, but he hits it on the ground too much, and he misses it too much. And here’s the thing: the parts of his game that are lacking and that are holding him back, are all things he can learn to be better at. He can learn to be a smarter baserunner. He can learn plate discipline. He can learn to hit the ball just a little lower than he does now, to get it into the air more.
The question is, will he?
If he does, he creates a new category, combining the best of O’Hearn/Naylor with the best of Alonso/Casas, and he’d be better than all of them.
Who’s on first?
So what should the Red Sox do? If they can get Pete Alonso in to play first base for them, should they?
Alonso would certainly help the lineup. But if Triston Casas has a healthy year, he’s basically a Pete Alonso clone for much less money.
What if Casas is injured again, though? He sure seems injury prone. Then your backup plan is Romy Gonzalez, who is as good as your second-or-third best first base free agents that were on the market at the start of this offseason. And with the right coaching and effort, could end up being better than all of them in the short term.
So regardless of whether Casas can or can’t play, the Red Sox will have a plus option at first base. They don’t need Alonso to play first base for them.
But Alonso would improve them at DH. But to make that room, they’d need to trade/drop Masataka Yoshida, to whom they owe $36M over the next two years, and probably one of their 4 top-notch outfielders. Not to say they won’t; they may. But they may not.
In the end, Alonso may not add as much value as people think he will, when compared to what the Red Sox would get from the current players who he would replace. All that may not be worth the expected $150M price tag.